Two pools quote 24%. In the first, every point comes from traders who wanted to swap. In the second, four points come from traders and twenty come from a token the protocol is printing.
Both numbers are accurate. They describe different instruments. One depends on traders continuing to trade. The other depends on a schedule, and on what the token is worth when you sell it.
Splitting those two lines before comparing anything is the core discipline. By the end, you should be able to take any quoted rate apart, price what the token issuance is really worth, and decide whether you are holding a liquidity business or a token position.
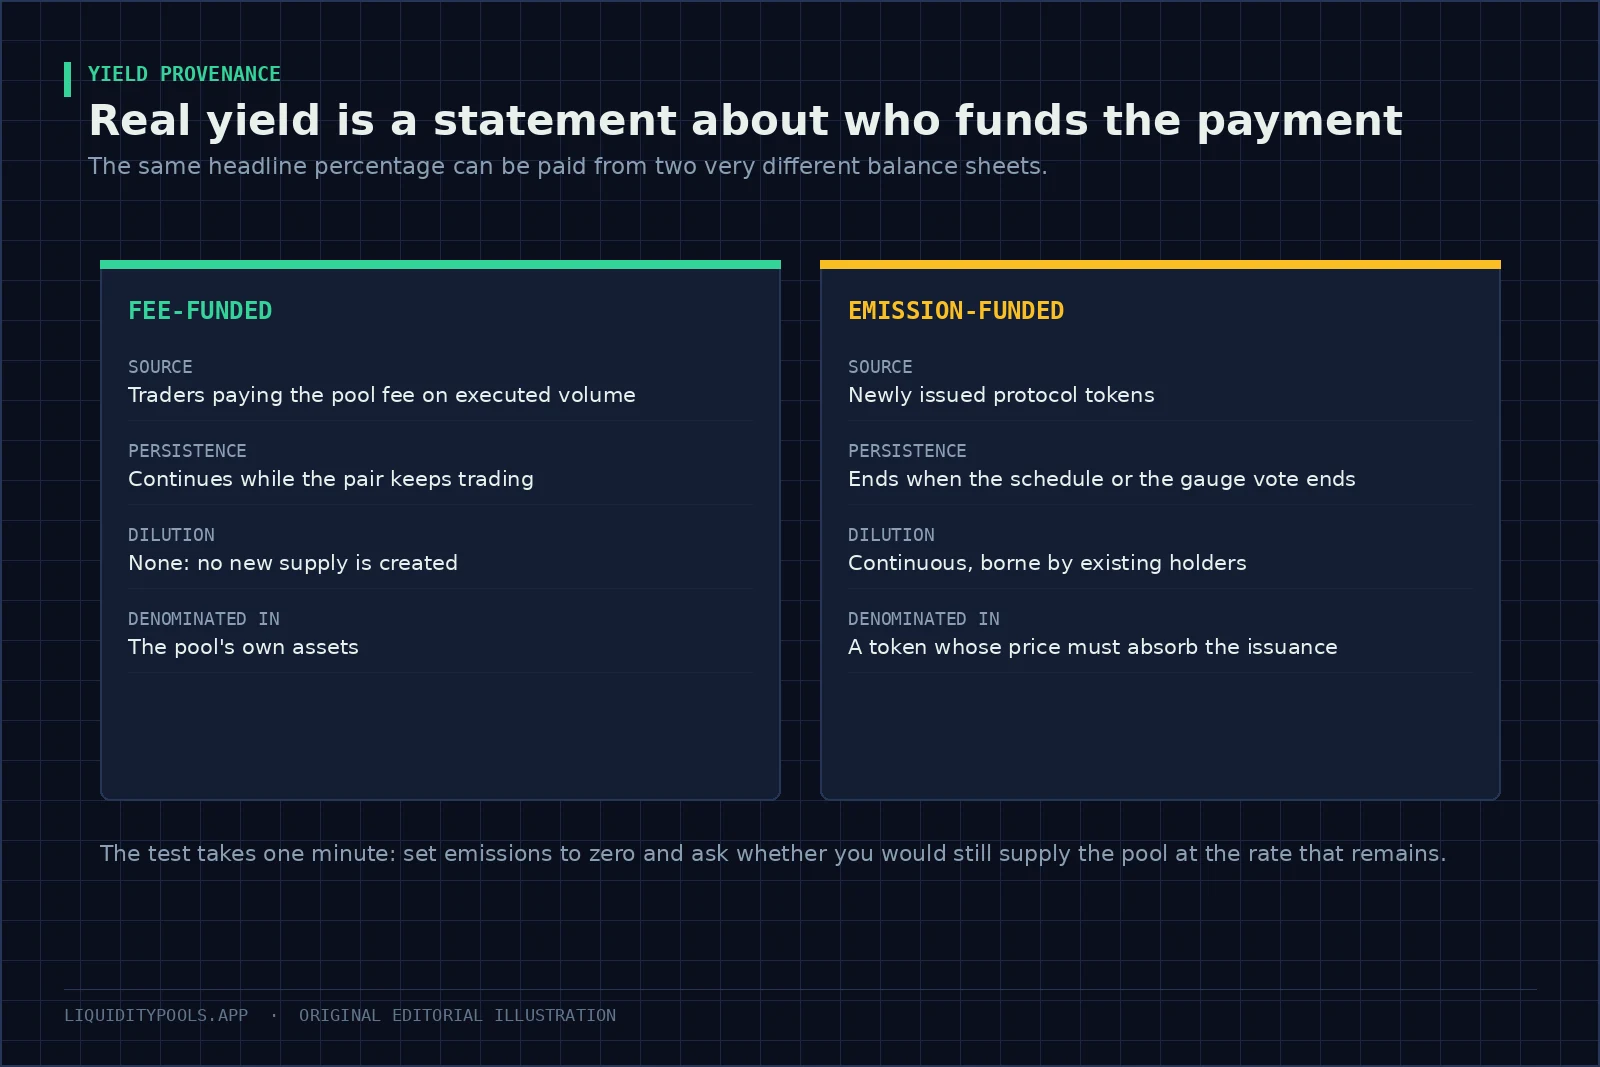
Key point: Ask what the position would earn tomorrow if token issuance stopped this evening. If the answer is near zero, the return is primarily an incentive-token exposure rather than a fee-supported liquidity business, and its risk should be evaluated accordingly. Record fees and incentives separately so the position remains measurable when emission rates or token prices change.
The two revenue lines
| Paid by traders | Paid by printing | |
|---|---|---|
| What it is a claim on | Activity that already happened | Supply that does not exist yet |
| How long it lasts | As long as the pair trades | Until a published date, or a vote |
| Who it dilutes | Nobody | Everybody holding the token |
| Does your own selling affect it | No | Yes, and everybody sells at once |
| What you receive | The pool’s own assets | Whatever the market absorbs |
The fourth row matters most. Fee income is collected in the pool’s own tokens as trades happen and shared among providers in proportion to their active liquidity[1]. Nobody else’s decision to withdraw their fees changes what yours are worth. Reward income is different, because everybody receiving it faces the same decision to sell at the same moment.
Reward tokens are usually governance tokens, issued as an incentive to use the protocol[4]. Studies of yield strategies treat trading fees, lending interest and token rewards as distinct sources of return, with different risks[5]. Lending interest has its own character — the instrument comparison is in Lending Pool vs Liquidity Pool.
Splitting any quoted rate
Most aggregators publish the two separately. DefiLlama, for example, reports a base rate from fees and a reward rate from incentives as separate fields, and excludes rewards that are not yet tradable[3]. Where a source does not split them:
Where:
- Fees over a window is what the pool actually collected.
- Liquidity supplying them is the money competing for those fees.
Everything above that figure in the quoted rate is issuance. Verify the base over at least thirty days, because volume clusters around events and one day will not repeat. The fee side of that split, from routed volume and your share of the active liquidity, is what the liquidity pool fee and APR calculator computes.
Worked:
| Value | |
|---|---|
| What the pool quotes | 41.0% |
| Fees collected over 30 days | $96,000 |
| Average liquidity | $14,000,000 |
| So the real fee yield is | 8.3% |
| Which makes the issuance portion | 32.7% |
| Reward token’s price over the last 90 days | −38% |
| Issuance after a 38% haircut | 20.3% |
| Adjusted total | 28.6% |
The fee yield is $96,000 ÷ $14,000,000 × 365 ÷ 30 = 8.3%. The haircut is not a forecast. It is a stress case: it asks what the issuance is worth if the token keeps falling at its recent pace while you sell what you receive.
What the printing actually costs
Where:
- is the weekly issuance as a fraction of circulating supply.
- is the fraction of recipients who sell within the week.
For the quoted rate to hold, genuine demand has to absorb that flow without the price falling. Three checks make it concrete:
- Read the schedule from the contract, not the interface. Note the rate, the decay, and whether governance can change it. DeFi protocols keep governance processes that can reset parameters like these[8].
- Compute weekly issuance as a share of supply. Compounding makes small weekly numbers large. Issuing 1% a week adds about 68% to supply in a year, and 2% a week adds about 180%. Unless demand grows as fast, the price absorbs the difference.
- Compare issuance against the token’s actual trading volume. If a week’s issuance is worth more than a typical day’s trading, recipients selling even part of it become a large share of all trading in the token.
See Liquidity Mining Explained and Yield Farming Explained.
The test that takes ten seconds
Set the rewards to zero and ask whether you would still supply at what remains, given how much the pair moves. Four illustrative pools:
| Pool | Quoted | Fees only | What fees must cover | What it actually is |
|---|---|---|---|---|
| Mature stable pair | 6.5% | 6.1% | Very little | A liquidity business |
| Deep ETH tier | 19.0% | 14.5% | Moderate | A liquidity business |
| Mid-cap, incentivised | 44.0% | 3.2% | High | A token position |
| New launch, heavy farm | 180.0% | 0.9% | Very high | Entirely a bet on the token |
Rows three and four are not automatic rejections. They are reclassifications. Size them, watch them and exit them as token exposures, because that is what you are holding.
Issuance has a legitimate job. Incentives helped make many pools the deepest venues for their tokens in the first place[6]. Being paid to bootstrap that depth can be a sound trade, as long as you price it as a token position.
The fee-only rows also show why a high fee yield is rarely free. One study of Uniswap v3 providers found that simple strategies in pools with negligible volatility were profitable but modest. Larger returns came only with more risk and active management[7].
Not all fee income is durable either
Three things separate income that lasts from a temporary spike:
- Who the volume comes from. Arbitrage pays a fee but reprices the pool at your expense, so the same headline volume can be worth much less than it looks. The cost is measured as loss-versus-rebalancing (LVR), the value a pool gives up to arbitrageurs because its price lags the market[2]. See Loss-Versus-Rebalancing.
- Why the pool has the volume. A pool that holds routed volume because it is the deepest venue keeps it. One holding volume because of a temporary reward does not.
- Whether the tier fits. A tier chosen for the pair’s volatility earns through cycles. A mismatched one loses volume in calm markets or loses money in volatile ones.
A taper, from inside a position
A pool paying 38%, of which 30 points are rewards, announces a halving in two weeks.
| Liquidity | Quoted rate | Fee-only yield | |
|---|---|---|---|
| Week zero | $60M | 38% | 8% |
| Week one, people start leaving | $48M | about 48% | 10% |
| Week two, the halving lands | $28M | about 49%, on paper | 17%, on paper |
The quoted rate went up, because the money left faster than the rewards were cut. That is the first surprise.
Now the second-order effect that is easy to miss. With less depth, large orders cost more, routers send a smaller share of flow, and realised volume falls. If it falls by a third, the fee-only yield lands near 11%, and the quoted rate near 44%.
So the fee-only yield ends up above where it started and well below the naive calculation that assumed volume was independent of depth.
A provider who modelled fee-only yield at entry could see roughly where this would land, and decide in advance whether to stay. A provider who annualised the launch week met the taper as a surprise, and left through a thinner market than the one they entered. Planning to leave early does not solve this, because every other provider reads the same published schedule.
In a typical programme, neither the issuance nor the taper is hidden. Both are in the schedule before the first deposit.
A portfolio policy that works
- Core positions in pools that clear their hurdle on fees alone, sized for a long horizon.
- Satellite positions in incentivised pools, sized as token exposure, with a fixed selling schedule and a defined exit when the taper starts.
- No positions justified only by a rate you have not taken apart.
That policy is dull, which is the point. It removes the failure mode where a portfolio quietly drifts into holding a basket of farm tokens that nobody ever decided to buy.
The checklist
- Split every quoted rate into fees and issuance before comparing anything.
- Verify the fee part against thirty days of pool data.
- Read the schedule and its decay from the contract.
- Compute weekly issuance as a share of supply, and against the token’s volume.
- Haircut the reward value to what a realistic selling schedule actually gets.
- Run the zero test and classify the position accordingly.
- Set an alert for proposals that change reward weights or rates.
Real yield is not a marketing category, and it does not mean low yield. It is a question about who is paying you, and the answer changes how you should size the position. Split APR against APY with APR vs APY in DeFi, and separate emissions from fee income with Yield Farming Explained.
References
- Uniswap v3 Core (Adams et al., 2021)
- Automated Market Making and Loss-Versus-Rebalancing (Milionis et al., 2022)
- DefiLlama yield-server README: adapter output specification (DefiLlama, GitHub)
- The Financial Stability Risks of Decentralised Finance (Financial Stability Board, 2023)
- SoK: Yield Aggregators in DeFi (Cousaert, Xu & Matsui, 2021)
- When does the tail wag the dog? Curvature and market making (Angeris, Evans & Chitra, 2020)
- Risks and Returns of Uniswap V3 Liquidity Providers (Heimbach, Schertenleib & Wattenhofer, 2022)
- DeFi risks and the decentralisation illusion (Aramonte, Huang & Schrimpf, BIS Quarterly Review, December 2021)
Frequently asked questions
What is real yield in DeFi?
Income paid out of fees actually collected from users, rather than out of newly issued tokens. It matters because fee-funded income persists while the protocol has activity, whereas emission-funded income ends when the schedule ends and dilutes existing holders while it runs.
How do I tell how much of a pool's yield is real?
Split the quoted rate into base fee yield and reward yield, which most yield aggregators publish separately, then verify the base figure against the pool's own fee and liquidity data over at least thirty days.
Is emission-funded yield always bad?
No. Bootstrapping depth on a new pair is a legitimate use of issuance, and being paid to provide that depth can be a sound trade. The error is counting issuance as income without pricing what issuing it costs the token you are being paid in.
Is a high APY liquidity pool safe?
A persistently high rate is compensation for something specific: volatility, thin liquidity, a taper schedule, or an unreviewed contract. Identify which before deciding whether the rate is adequate for the exposure.
What happens to a pool when emissions stop?
Capital that arrived for the emissions often leaves quickly. Depth falls, routers send less volume, and fee income for the remaining providers declines. Pools that were viable on fees alone survive the transition; the others do not.
Continue in this track
This is guide 6 of 12 in Advanced.
Next: Liquidity Mining Explained: Incentives, Emissions and Lasting Depth →
Previous: ← The Liquidity Pool Research Checklist: Questions to Ask Before You Act
See the full track sequence, or browse all 59 guides.