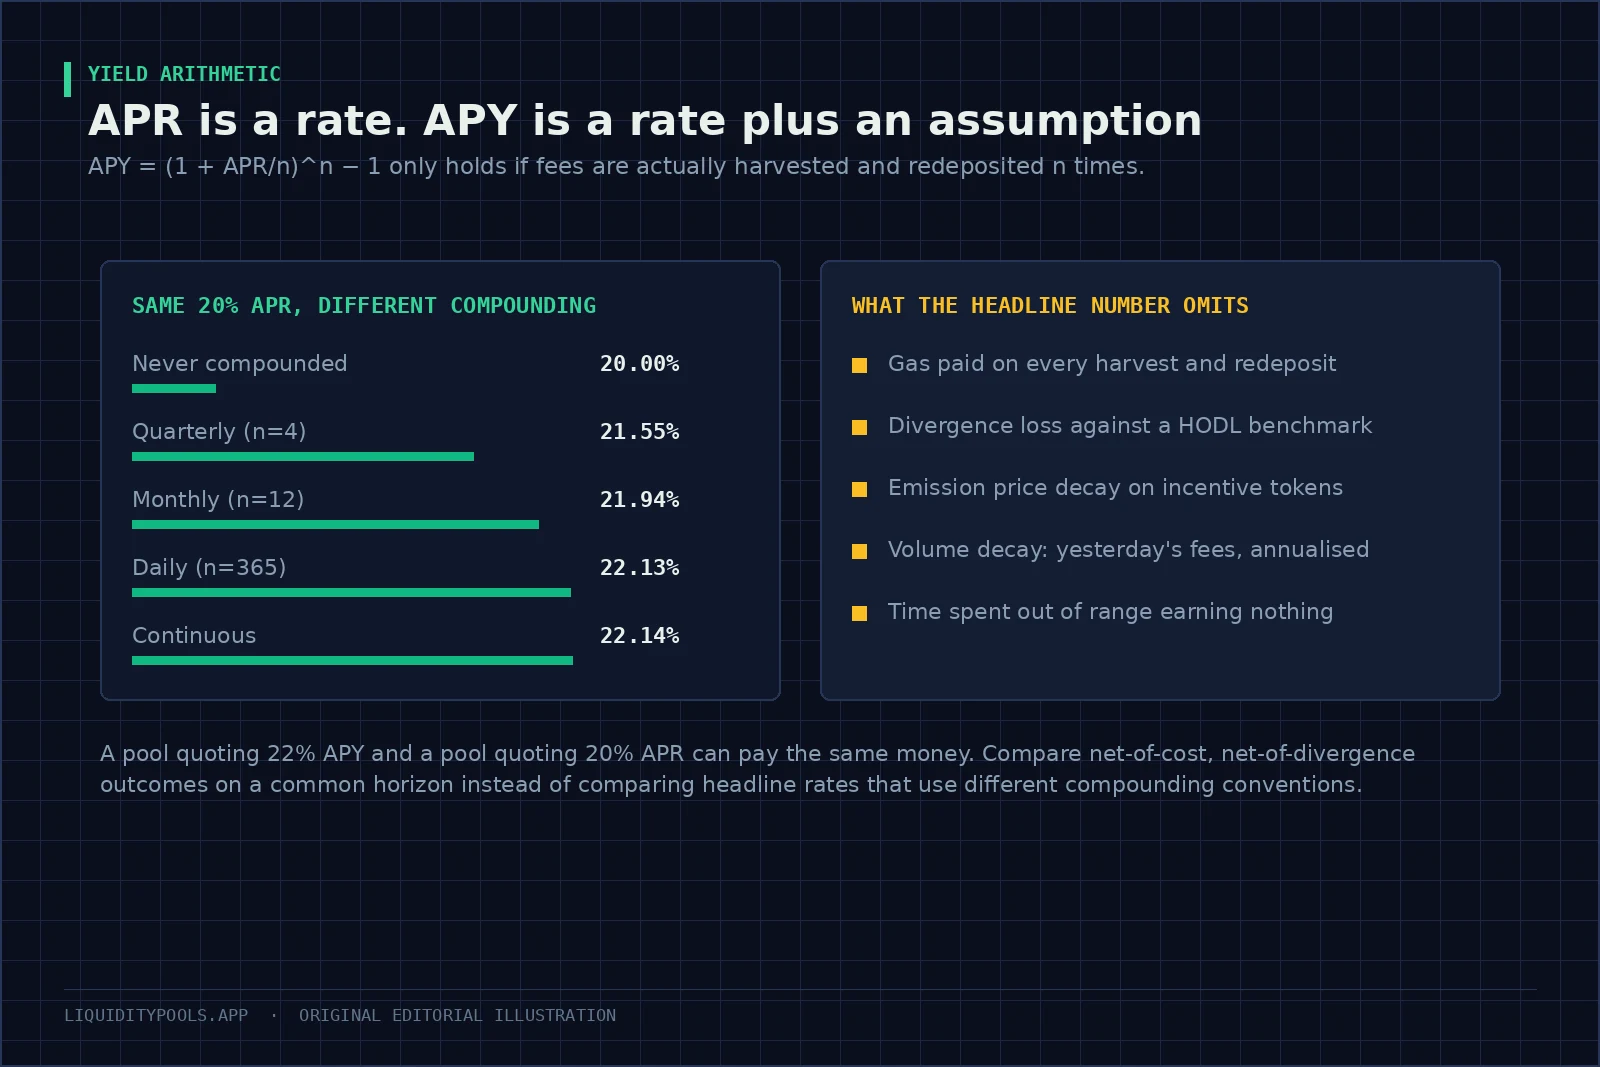
A pool advertising 22% and a pool advertising 20% can pay you exactly the same money. One assumed you would compound daily, the other assumed nothing.
Neither number tells you what you will actually make. Both are recent results projected forward, with no adjustment for what you are taking on.
Reading these properly is mechanical and takes a few minutes. By the end you can convert any quote to a common basis, strip out what it leaves out, and compare two pools on the same footing.
Key point: Start with the denominator and the measurement window, not the yield headline. A 40% figure computed from one busy day is not a forecast, especially when your deposit would double the pool’s liquidity and halve each provider’s share of the fees.
Converting between the two
APR, the annual percentage rate, is a simple rate with no compounding. APY, the annual percentage yield, assumes you reinvest the earnings a set number of times a year. The more often you reinvest, the more the two numbers drift apart.
Where:
- is the simple rate, with no compounding.
- is how many times a year the quote assumes you harvest and redeposit.
- is the result of doing that.
For a 20% simple rate:
| How often you compound | What it becomes |
|---|---|
| Never | 20.00% |
| Quarterly | 21.55% |
| Monthly | 21.94% |
| Weekly | 22.09% |
| Daily | 22.13% |
| Continuously | 22.14% |
That is about two points of difference at this level, and it widens fast. A 100% simple rate becomes 171% if compounded daily. So any comparison between a pool quoting one convention and a pool quoting the other has to convert first.
Compounding in a pool is not always automatic. In a full-range pool such as Uniswap v2, fees are added to the pool and compound on their own[7]. In range-based pools your fees are stored separately and earn nothing until you collect them and add them back, which costs a transaction[1]. A quoted compounded rate on such a pool assumes you will actually do those harvests.
When compounding is worth the gas
Compounding only pays if the extra yield beats what the harvests cost you. On Ethereum, every transaction pays gas — the units of work it uses times a price per unit — whether it succeeds or not, and that price rises when the network is busy[2]. The arithmetic is short enough to do before you deposit.
Take $5,000 at a 20% simple rate.
| How often you harvest | Extra a year from compounding | Harvests a year | Most you can pay per harvest and still gain |
|---|---|---|---|
| Monthly | $97 | 12 | $8.08 |
| Weekly | $105 | 52 | $2.01 |
| Daily | $107 | 365 | $0.29 |
Read the right-hand column against what a harvest costs on your chain. A claim-and-redeposit is two contract actions. On Ethereum mainnet that can easily cost more than $0.29 even on a quiet day, so daily compounding on this position would lose money. On a low-cost layer-2 network the break-even may be easy to clear.
The pattern holds at any size. The benefit of compounding grows with your position, but the gas per harvest does not[2]. So a small position should harvest rarely, and a quote that assumes daily compounding on a small deposit describes income you will not collect.
Where the number comes from
Most pool rates are trailing fees divided by the money that earned them, scaled up to a year.
Where:
- Fees over a window is what providers collected in that period, after any protocol fee. Since a December 2025 governance vote, Uniswap keeps 0.05 points of the 0.30% fee on every v2 pool and a share on selected v3 pools[7].
- Liquidity supplying them is the denominator, which varies by interface.
- Days in the window is the length of the sample, from one day to a month or more.
Three things follow, and all three can change the answer.
- The window. A 24-hour window during a busy day produces a number that may not repeat. Thirty days smooths it but lags a change in conditions.
- The denominator. One interface may divide by the pool’s total, another by only the money working near the price. In a range-based pool, only liquidity covering the current price earns fees[1], so the two can differ by an order of magnitude. The second tells you what in-range money earned. The first tells you what the average deposit earned.
- You. Your deposit joins the denominator. If you are large relative to the liquidity near the price, the rate you get is lower than the one you saw.
See Onchain Liquidity Metrics and TVL Explained.
Six costs no headline rate includes
- Impermanent loss — what a pool position gives up against holding the two tokens. On volatile pairs it can exceed the fee income. A study of 17 large Uniswap v3 pools found providers lost $260.1 million against holding while earning $199.3 million in fees[5].
- Time out of range. The income stops while your capital stays committed[1].
- Gas. Entry, every harvest, every rebalance, exit[2].
- Reward tokens losing value. If part of the rate is paid in a token being continuously issued, what you realise is lower than what accrued.
- Swapping into the right ratio, especially for single-asset deposits routed through a converter.
- Exit conditions imposed by a vault or, on newer pools, by attached code.
An honest comparison expresses everything as a net result over a stated period, against a stated benchmark. For a two-token position, that benchmark is holding the two tokens. Studies of real Uniswap v3 positions show why: outcomes vary widely, and the high returns come with more risk and active management[4].
Two further points are worth having.
Auto-compounding vaults make the compounding assumption real rather than notional, because they do the harvesting for you[3]. In exchange you add a contract to the trust chain, a performance fee, and a schedule somebody else chose[3]. Read the realised harvest frequency rather than the advertised one, because high gas can push the real cadence below the schedule used to compute the quote.
Do not compare a stablecoin rate with a volatile-pair rate, even after converting. The first is close to a cash return with a tail risk attached to a peg. The second is a bet on volatility with an income leg. Putting them on the same axis misprices both.
Real fees against printed tokens
Two components behave differently, and they should never be summed without labels.
| Fee income | Token issuance | |
|---|---|---|
| Who funds it | Traders paying the pool | New supply, printed |
| Does it last | As long as people trade | Until the programme ends |
| What it depends on | The pool’s own trading | Whether anyone will buy the token |
| Who it dilutes | Nobody | Everybody already holding |
| What you actually get | Collect and keep, or sell | Whatever the market pays when you sell |
On Curve, for example, some pools pay CRV rewards on top of trading fees, and you only earn them by staking your LP tokens in a separate gauge contract[6]. Yield aggregators treat these reward tokens as a separate source of yield from trading fees, with their own risks[3].
A pool quoting 45% where 40 points come from issuance is a different instrument from one quoting 12% entirely from fees. See Liquidity Mining Explained and Yield Farming Explained.
Normalising two competing quotes
Pool A quotes 18%, compounded daily, entirely from fees. Pool B quotes 26% simple, of which 17 points are paid in a token that has fallen about 4% a month.
Two assumptions make the comparison concrete. First, you sell reward tokens as they arrive and the token keeps falling at the same pace, so over a year you realise about 79% of their quoted value. Second, Pool A’s pair costs about 2 points a year in divergence against holding. Pool B’s pair is twice as volatile, and divergence grows with the square of volatility, so about 8 points.
| Step | Pool A | Pool B |
|---|---|---|
| Convert to a common basis | 16.6% simple | 26% simple |
| Haircut the token portion | unchanged | 17 points becomes about 13.4 |
| Compare like with like | 16.6% | about 22.4% |
| Subtract divergence for the pair | about 14.6% | about 14.4% |
| Subtract harvest and sale costs | none | material on a small position |
Pool B looks six points better after the first three rows. After divergence the two are level, and Pool B’s harvest and sale costs put it behind. Change the assumptions and the answer moves, which is the point: the headline alone cannot rank them.
The checklist
- Is it simple or compounded, and at what frequency?
- What window produced it, and was that window representative?
- What is the denominator, the pool total or the money working near the price?
- Split it into fees and issuance.
- Estimate the divergence for this pair over the same window.
- Add your own deposit to the denominator and recompute.
- Subtract gas for the harvest cadence the quote assumed.
- Express it net, against holding the basket, and only then compare.
These numbers are not dishonest by design. They are summaries that happen to discard the information you need, and putting it back takes a few minutes.
Where to go next
Rebuild any quoted rate from its inputs with the liquidity pool fee and APR calculator, then subtract what it leaves out with the impermanent loss calculator. If you are weighing a pool against other single-token yields, Liquidity Pool vs Staking and Liquidity Mining vs Yield Farming separate the instruments, and Liquidity Pools for Beginners covers the mechanics underneath any quoted rate.
References
- Uniswap v3 Core (Adams et al., 2021)
- Ethereum gas and fees: technical overview (ethereum.org)
- SoK: Yield Aggregators in DeFi (Cousaert et al., 2021)
- Risks and Returns of Uniswap V3 Liquidity Providers (Heimbach et al., 2022)
- Impermanent Loss in Uniswap v3 (Loesch et al., 2021)
- Providing Liquidity in Pools (Curve Finance Documentation)
- Fees (Uniswap Developers Documentation)
Frequently asked questions
What is the difference between APR and APY in DeFi?
APR is a simple annualised rate with no compounding assumption. APY assumes the return is harvested and redeposited a set number of times per year, so it is always the larger number for the same underlying performance. Converting between them requires knowing the compounding frequency the quote assumed.
Is a higher APY always better?
No. A quoted APY says nothing about where the yield comes from, how volatile it is, whether it is paid in a token you can sell, or what divergence loss the position carries. Two pools quoting the same number can have completely different net outcomes.
How is liquidity pool APR calculated?
Usually as the trailing fee revenue of the pool over a short window, divided by the value of liquidity supplying it, then scaled to a year. That makes it a backward-looking estimate that is highly sensitive to the window chosen and to how much liquidity is competing for the same volume.
What is real yield?
Revenue paid from fees actually collected from users rather than from newly issued tokens. It is a useful distinction because emission-funded yield depends on the token price holding up against continuous issuance, while fee-funded yield does not.
Continue in this track
This is guide 13 of 14 in Foundations.
Next: Onchain Liquidity: How Decentralized Markets Are Assembled →
Previous: ← TVL Explained: What Total Value Locked Can—and Cannot—Tell You
See the full track sequence, or browse all 59 guides.