The headline figure counts deposits. Depth counts what can actually be traded right now. On range-based pools those two can differ by a factor of ten or more.
Only depth has any bearing on what a trade costs you or what a position earns.
Measuring it properly takes a few minutes. By the end you will be able to turn a pool’s depth into the largest order it can take at a cost you accept, and to tell two look-alike pools apart.
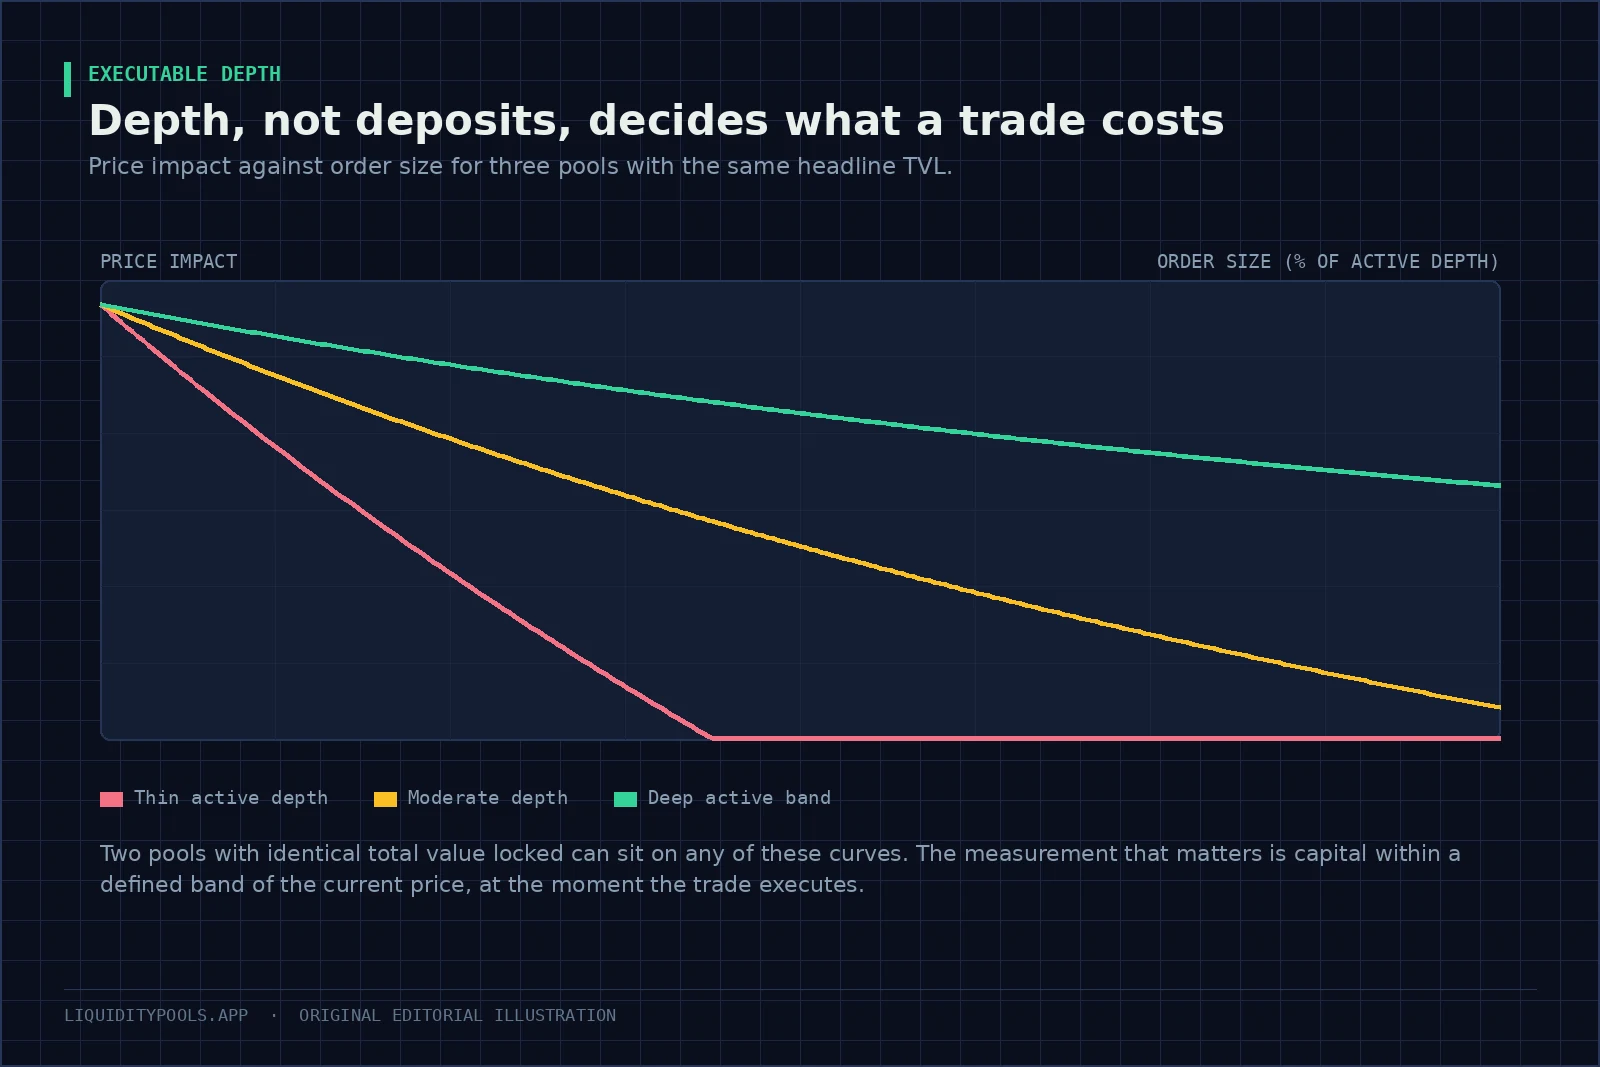
Key point: Size a position from executable depth within a stated price band, such as 2% on both sides, rather than from headline TVL. That measure is closer to what can absorb an urgent exit and may be only a fraction of the total deposits shown by an analytics site.
What depth actually measures
Depth means nothing without a price band attached. The question is always: how much can be traded before the price moves by some amount?
In an ordinary constant-product pool, the price comes straight from the two balances, and every trade pays a premium that grows with its size[2][3]. Other pool designs bend that cost curve differently[6]. In this one, your shortfall against the screen price, before fees, follows from one ratio.
Where:
- is your order size, in the token you are paying in.
- is the pool’s balance of that same token.
- is how much worse your average price is than the price on screen.
Because sits on both the top and the bottom, impact rises almost one for one with order size while orders are small. It then bends upward as the order becomes a real share of the pool.
In a range-based pool it takes more work. Liquidity is constant within each price step, called a tick, and changes only where positions begin or end[1]. Depth across a band is the sum across the steps it covers, converted to a dollar value at the prices involved. Positions whose range does not include the current price contribute nothing[7].
Bin designs are simplest. Each bin holds a known amount at one fixed price, so you add the bins up[8]. See Uniswap v3 Ticks and Position NFTs.
Turning depth into a maximum order
The useful output is not a depth figure. It is the largest order you can send at a price impact — the amount your own order pushes the rate against you — that you are willing to pay.
In a constant-product pool you can read it straight off the balance of the token you are paying in. Rearranging the formula above gives the table.
| Worst price you will accept, against the quote | Largest order, as a share of that balance |
|---|---|
| 0.5% worse | about 0.5% |
| 1% worse | about 1.0% |
| 2% worse | about 2.0% |
| 5% worse | about 5.3% |
So a pool holding $4M of USDC takes a buy of about $40,000 before your average price is 1% worse than the screen, before fees. In a range-based pool, use only the liquidity inside the band your order will cross. That is usually much smaller than the headline.
Four reasons it differs from the headline
- Where the money sits. Capital in ranges far from the price contributes nothing to what you can trade today[7].
- It is lopsided. Depth above the price and below it are different numbers, often very different after a trend.
- It is split. The same pair across several fee tiers, chains and venues has less usable depth at any one of them than the total implies.
- Some of it is temporary. Just-in-time liquidity is added for the single block containing a large trade and removed straight after[4]. It fills that one trade and is not there for anybody else. Uniswap Labs found it rare across Uniswap v3 as a whole[4].
See TVL Explained.
Two pools, same headline
Both show $40M on the same pair. The figures below assume the working liquidity is spread evenly across a band 2% either side of the price, and they exclude fees.
| Pool A | Pool B | |
|---|---|---|
| Headline size | $40M | $40M |
| Working within 2% of the price | $26M | $3.5M |
| Buy that moves the price up 1% | about $6.6M | about $890,000 |
| Cost of a $500,000 buy, against spot | about 0.04% | about 0.28% |
| Cost of a $2M buy, against spot | about 0.15% | runs past the band, so it depends on liquidity outside it |
For small orders the cost scales with the inverse of working depth, which is why Pool B costs about seven times as much per trade. Pool B can absorb only about $1.8M of buying before it reaches the edge of its band.
Pool B is not broken. It may hold most of its liquidity in ranges placed for a different price, or it may be a wide-range pool on a volatile pair.
But routers send size to Pool A, which means Pool A’s providers earn the fees. And anyone who assumed the two were interchangeable pays the difference — partly as price impact, partly as slippage, the gap between the quote you saw and the fill you got. See Slippage and Price Impact.
Depth from the supplier’s side
If you are supplying, depth is the denominator of your fee share. Put money into a band that is already full and you capture a small fraction of what happens there.
That leads to a result that surprises people. A pool with thin depth can be a better place to supply than a deep one, as long as volume still routes to it.
The number to compare is fee revenue per unit of liquidity in the band, not the pool’s size. That is what the liquidity pool fee and APR calculator works out.
The competition matters too. Depth in a band is not fixed. A reward programme or one large deposit can double it overnight, halving everybody’s share with no change in volume.
When depth disappears
Everything above is a snapshot, and the moments that matter most are those where a snapshot is least useful.
During a sharp move, three things happen at once:
- Range positions get pushed out and stop quoting. Once the price leaves a position’s range, that liquidity is no longer active[7].
- Active providers withdraw rather than hold inventory through the move.
- The trades arriving are larger, because many people react at the same time.
So depth measured on a quiet afternoon overstates what will be there during the window you actually need it. A pool showing $26M within 2% on a Tuesday may show a small fraction of that during a liquidation cascade, and no average will reveal it.
Two defences:
- Size against a stressed assumption, discounting the calm measurement substantially.
- Look at historical depth during past volatile episodes. That history is recoverable from chain data and is a far better guide to your exit than today’s reading.
Depth and volatility together
Depth on its own is incomplete. A deep pool on a highly volatile pair can still produce poor outcomes for providers, because arbitrageurs trade against that depth every time the outside price moves.
| High turnover | Low turnover | |
|---|---|---|
| Deep | Good fills and steady fees | Good fills, thin fees, idle capital |
| Thin | High fee density, poor fills, fragile under stress | Poor on every count |
Add volatility as a third axis. Thin and volatile is the one combination where you should neither supply nor route trades.
Gas is the other cost a quote leaves out. Research comparing centralised and decentralised exchanges found that gas weighs heavily on small trades, while larger trades on decentralised venues can be competitive on cost[5].
The checklist
- Measure within 2% on both sides, before trading or supplying.
- Convert that into a maximum order size at the impact you will tolerate.
- Compare across tiers and venues for the same pair, never in aggregate.
- If supplying, compute revenue per unit of liquidity in your intended band.
- Re-measure after any reward programme starts. Depth moves before volume does.
- Check the asymmetry after a trend. The side you need may be the thin one.
- Never use the headline figure as a proxy for any of this.
Where to read it
- Pool interfaces publish a liquidity distribution chart. Read the steps around the current price, not the overall shape.
- Dune Analytics exposes tick-level liquidity for major pools, which lets you do the band calculation properly.
- Aggregator quotes are a practical shortcut. Request quotes at several sizes and see where the cost curve turns up.
- Reading the contract gives the authoritative answer: current price, active liquidity, and the initialised ticks around it[1].
Whichever you use, measure at the moment you intend to act, because depth changes every block. Turn the measurement into a pool decision with How to Evaluate a Liquidity Pool, and track it alongside the other numbers in Onchain Liquidity Metrics.
References
- Uniswap v3 Core Whitepaper (Adams et al., 2021)
- Uniswap v2 Core Whitepaper (Adams et al., 2020)
- DeFi risks and the decentralisation illusion, Box A: Trading in the DeFi era: automated market-makers (BIS Quarterly Review, December 2021)
- Just-In-Time Liquidity on the Uniswap Protocol (Wan & Adams, Uniswap Labs, 2022)
- On The Quality Of Cryptocurrency Markets: Centralized Versus Decentralized Exchanges (Barbon & Ranaldo, 2021)
- SoK: Decentralized Exchanges (DEX) with Automated Market Maker (AMM) Protocols (Xu et al., 2021)
- Concentrated Liquidity (Uniswap Developers documentation)
- Liquidity Book DLMM: Primer (LFJ Documentation)
Frequently asked questions
What is liquidity depth in crypto?
The amount of capital available to absorb a trade within a defined price band. In a pool it is the liquidity active near the current price, and it is the quantity that determines execution cost, unlike total value locked, which counts deposits regardless of where they sit.
How do you measure pool depth?
Compute the value that can be traded before price moves by a set percentage, typically two percent in each direction. In concentrated pools this means summing liquidity across the ticks inside that band rather than reading a headline figure.
Why does a large pool sometimes have bad execution?
Because most of its capital can sit in price ranges the market is not trading in. A pool with large deposits parked far from the current price offers less executable depth than a smaller pool concentrated around the current price.
What is the difference between spot price and execution price?
Spot is the marginal price for a very small trade. Execution price is the average you actually receive across the whole order. In a pool it is always worse than spot for a trade of any real size, even before fees, because the trade moves along the curve as it fills.
How much of a pool can I trade against?
As much as your tolerance for price impact allows. Decide the worst average price you will accept, then convert it into a maximum order using the active depth near the current price, not the pool's total value. In a constant-product pool, a 1% tolerance allows an order of about 1% of the balance you are paying into.
Continue in this track
This is guide 12 of 16 in Risk & Research.
Next: Token Liquidity Analysis: Measuring What Can Actually Be Sold →
Previous: ← Rug Pulls and Locked Liquidity: Six Checks Before You Deposit
See the full track sequence, or browse all 59 guides.