You can buy almost any token. The question nobody puts on a listing page is whether you can sell it again, and at what price.
Market capitalisation is just price times supply. Volume is activity that may or may not be real. Neither tells you what it costs to get out on a bad day.
Six measurements do, and all six come from public chain data. By the end you will be able to turn them into one number: the largest position you could exit at a price fall you accept.
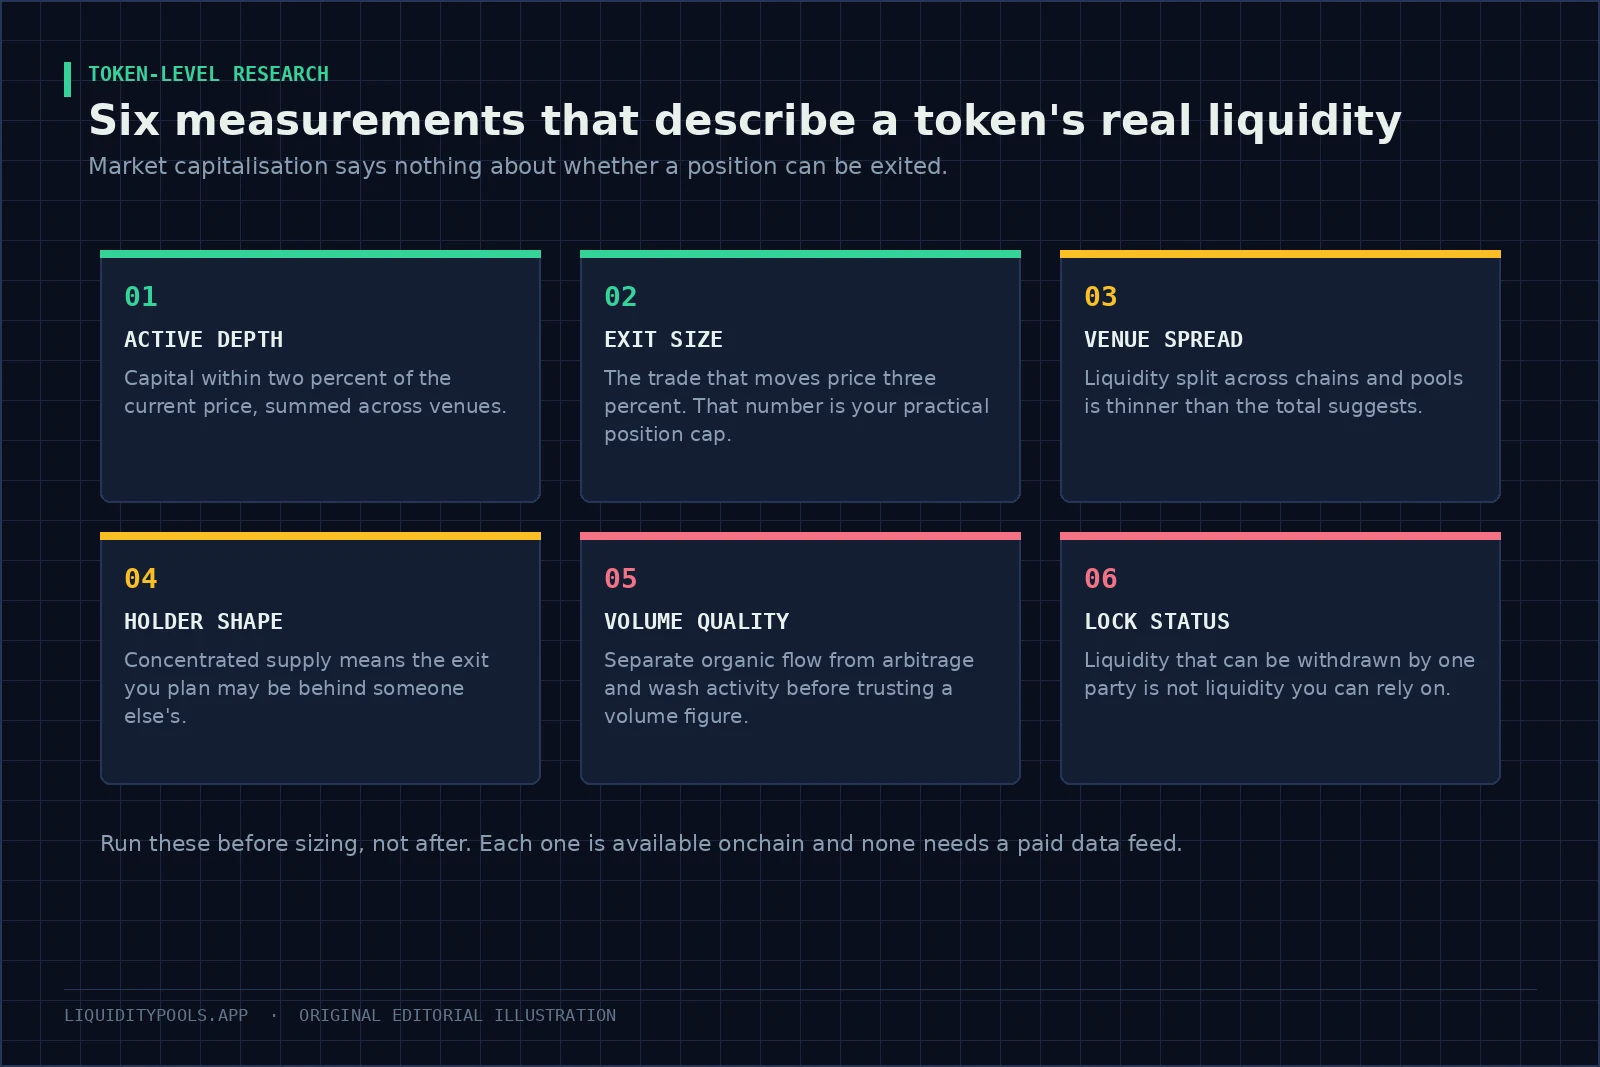
Key point: The decision-relevant number is the estimated cost of exiting the position under stressed depth. Market capitalization, daily volume, and holder count do not answer that question; current pool state can support a direct exit-cost scenario.
How much money is actually near the price?
Start with the pools. For every venue holding real liquidity in the token, add up the capital sitting within a defined band of the current price. Two percent in each direction is a good default. How that capital comes to sit in pools on the chain in the first place is the subject of Onchain Liquidity Explained.
In a simple constant-product pool that follows straight from the reserves[2]. In a concentrated pool you sum the liquidity across the ticks, the pool’s small price steps, inside your band[1]. Deposits parked in distant ranges contribute nothing to your exit. The full method is in Liquidity Depth and Execution.
Record the two sides separately. Depth is often lopsided after a trend, and the side you need is usually the thin one.
What can you sell before the price moves?
Now turn that depth into the number that governs how big your position can be.
Exit size is the sale that moves the price by exactly as much as you are willing to tolerate. In a constant-product pool it depends only on the pool’s balance of the asset you are selling into.
Where:
- is the value of tokens you could sell in one go, at today’s price.
- is the pool’s balance of what you receive, such as USDC.
- is the price fall you will accept, so 3% means .
For small tolerances the bracket is about half of . A 1% price fall lets you sell roughly 0.5% of the USDC side, and every extra point of tolerance buys a little more than the last.
Compute it at several tolerances, because the shape of the curve tells you more than any single point. The table uses a pool holding $10M of USDC opposite the token.
| Price fall you tolerate | Sell size it supports | What that means |
|---|---|---|
| 1% | about $50,000 | Routine exits, no urgency |
| 3% | about $153,000 | A full position exit for most people |
| 5% | about $260,000 | A stressed exit, still orderly |
| 10% | about $541,000 | Forced-selling territory |
A position bigger than the three percent figure is one you cannot leave without moving the market against yourself. That is a different risk from the one most people think they are taking.
Is the depth in one place or scattered?
The same token may trade across several pools, fee tiers and chains. Adding it all up overstates what is available at any one of them, and moving between them costs you.
Three checks:
- List every venue holding more than a trivial share of the depth, including centralised exchanges if the token trades there.
- Check whether the venues are actually linked by arbitrage. Research on decentralised exchanges found that gas costs leave price gaps between venues that persist[5]. Persistent differences mean the venues are not fully linked, and depth you cannot reach is depth you cannot count.
- For cross-chain deployments, treat each chain’s liquidity as separate. Bridging to reach it takes time and carries its own risk. See Cross-Chain Liquidity Explained.
Who else is going to be selling?
Depth answers what you can sell now. Concentration answers who is standing behind you in the queue.
- Top-holder share, excluding known contracts, staking pools and burn addresses.
- Unlock schedules for team, investor and incentive allocations, read from the vesting contracts rather than from a blog post.
- Emission rate, if the token is being printed for farms. That supply arrives continuously, and the farmers receiving it often sell. See Real Yield in Liquidity Pools.
A token with thin exit depth and a large cliff unlock approaching carries a specific, dateable risk rather than a vague one.
How much of the volume is real?
Reported volume mixes several activities that mean completely different things.
| Volume type | What it tells you | How to spot it |
|---|---|---|
| Ordinary swaps | Genuine demand and supply | Many different counterparties, varied sizes |
| Arbitrage | Prices being pulled back into line | Trades that close a price gap with another venue, bot addresses |
| Sandwich trades | A bot trading around someone else’s order | A buy and a sell by the same address on either side of one swap |
| Wash trading | Nothing at all | Repeating addresses, round sizes, self-matching |
Wash trading is not hypothetical. A study of two early decentralised exchanges found wash trading in more than 30% of the tokens traded there[6]. Arbitrage and sandwich trades are both forms of MEV — profit taken by controlling the order in which transactions run[3]. One study of the major decentralised exchanges counted $277M of arbitrage profit and $174M from sandwich attacks over 32 months ending in 2021[4].
Attribution tools such as EigenPhi separate arbitrage and sandwich flow from ordinary trading. If you are supplying liquidity, the mix matters directly to you. Arbitrage volume pays you a fee while repricing the pool at your expense. That cost is measured as loss-versus-rebalancing — what the pool gives up by quoting a price that lags the wider market[7]. See Loss-Versus-Rebalancing. For what routed volume pays a provider holding a share of that depth, the liquidity pool fee and APR calculator runs the numbers.
Every number above expires
Each of these figures describes one moment, and the moments that matter are the ones you cannot measure ahead of time.
Depth thins during volatility. Concentrated positions go out of range and stop quoting, and providers pull money out rather than hold inventory through a move. Volume rises at the same instant. So the exit you could actually get during a stressed hour can be much smaller than the calm-market figure.
Two adjustments make the analysis usable. Discount your current depth reading substantially when sizing, so the limit you plan around is a stressed measurement rather than a comfortable one. Then look up what depth actually did during the pair’s last volatile episodes. That history is recoverable from tick-level data and is a far better guide than anything you measure on a quiet afternoon.
Can the liquidity simply be removed?
Liquidity one party can withdraw at will is not liquidity you can rely on. Check where the pool’s claim sits, how much of it is locked, and until when. Then check the token contract for permissions that could impair transfers. A lock does not cover everything: documented scams lock the pool claim and then mint new tokens to drain the pool anyway[8].
The full sequence is in Rug Pulls and Locked Liquidity. For an established token this takes a minute and usually passes. For a recent launch it is the highest-value item on this list.
Two tokens, identical on paper
Token A and Token B both show a $40m market capitalisation and roughly $2m of daily volume. The analysis separates them completely. Both examples treat each pool as constant-product.
Token A trades in two pools on one chain, holding $15m of USDC between them. Routers split orders across both, so treat them as one pool. That gives about $300,000 of depth within 2% either side. Sixty-two percent of recent volume is ordinary swaps, and the top ten wallets hold 18% of supply. A three percent exit supports about $230,000.
Token B has $1.5m of USDC spread across five venues on three chains, with visible price gaps between them. The largest venue holds $500,000, where a three percent exit supports about $7,700. Even reaching all five at once would support only about $23,000. Seventy-eight percent of volume traces to arbitrage and repeated address pairs, 61% of supply sits in four wallets, and a cliff unlock lands in six weeks.
The headline figures are identical. The sensible position size differs by ten to thirty times. Only one of these two can absorb an ordinary allocation without the exit becoming the dominant risk, and that gap is invisible on any listing page.
Putting it on one page
- Depth within plus or minus 2%, both sides, by venue.
- Exit size at 1%, 3%, 5% and 10% price falls.
- Venue list with depth share and evidence they are linked by arbitrage.
- Top-ten holder share excluding contracts, plus upcoming unlocks.
- Weekly issuance as a share of circulating supply, if any.
- Volume split into ordinary, arbitrage and suspicious.
- Lock status of pooled liquidity, with amounts and dates.
- Your maximum position size, implied by the three percent exit figure.
That last line is the deliverable. Everything above it exists to produce one number you can size against. A position sized from that number behaves very differently in a bad week from one sized against a market capitalisation.
References
- Uniswap v3 Core Whitepaper (Adams et al., 2021)
- Uniswap v2 Core Whitepaper (Adams et al., 2020)
- Miners as intermediaries: extractable value and market manipulation in crypto and DeFi (BIS Bulletin No 58, 2022)
- Quantifying Blockchain Extractable Value: How dark is the forest? (Qin et al., 2021)
- On The Quality Of Cryptocurrency Markets: Centralized Versus Decentralized Exchanges (Barbon & Ranaldo, 2021)
- Detecting and Quantifying Wash Trading on Decentralized Cryptocurrency Exchanges (Victor & Weintraud, 2021)
- Automated Market Making and Loss-Versus-Rebalancing (Milionis et al., 2022)
- Do not rug on me: Zero-dimensional Scam Detection (Mazorra et al., 2022)
Frequently asked questions
How do you analyse a token's liquidity?
Measure the capital available within a defined price band across every venue, compute the trade size that moves price by a set percentage, then check how much of the reported volume is ordinary trading rather than arbitrage or wash activity.
What is exit liquidity?
The size that can be sold without moving price beyond your tolerance. It depends on active depth on the sell side, not on market capitalisation or headline volume, and it sets the practical cap on any position.
Is high trading volume a good sign?
Only if the volume is ordinary trading. Reported volume can include arbitrage between venues and wash trading, and studies of decentralised exchanges have found wash trading in more than 30% of traded tokens on the venues examined. Neither kind shows that a position could be exited at the quoted price.
How much liquidity is enough?
Enough that your intended position is a small fraction of the depth you could exit into under stress, not under current conditions. Work out the price fall you would accept on a full exit, then size the position so the stressed exit stays inside it.
What onchain data should I check first?
Pool addresses and their reserves, liquidity distribution around the current price, holder concentration excluding known contracts, the lock status of pooled liquidity, and a breakdown of recent swaps by counterparty type.
Continue in this track
This is guide 13 of 16 in Risk & Research.
Next: Onchain Liquidity Metrics: What to Measure Beyond TVL and Volume →
Previous: ← Liquidity Depth and Execution: The Only Number That Trades
See the full track sequence, or browse all 59 guides.