The width of your band is the main thing you control. Many people pick it from a yield they would like rather than from what the pair actually does.
That gets it backwards. The width decides how much of the time your position is even taking part in the market.
By the end you will have three measurable inputs, a table for how long each width tends to last, and a worked example showing when narrow wins and when it loses.
Key point: Ask what the position does if you go away for three weeks. If the honest answer is that it leaves its range on day four and then sits there, the width was chosen for a spreadsheet rather than for the market. Set it so the position survives your own attention span.
Three things to measure first
How much the pair actually moves. Compute volatility from recent returns, not from memory. Look at seven days and thirty days together, so you can see whether the current period is unusual.
What the width buys you. A band backs more depth than the same money spread over all prices, and the narrower the band, the larger the multiple.
Where:
- and are your two bounds, with the current price near the middle.
- is how many times more depth your money backs than a full-range position.
That is roughly twenty times at plus or minus 10%, and a hundred at plus or minus 2%. The multiple only applies while you are in range, because outside it the position earns no fees[7].
What one management cycle costs. Gas for withdrawing and re-minting, plus the swap fee and price impact (how far your own swap moves the price against you) on rebalancing the tokens. Gas is a fixed amount per transaction, whatever your position size[8], so it weighs more heavily on small positions. See Gas Costs for Liquidity Providers.
How long each width lasts
Roughly how long before the price touches a boundary, by width and by how much the pair moves in a typical day:
| Band | Moves 2% a day | Moves 4% a day | Moves 7% a day |
|---|---|---|---|
| Plus or minus 2% | about 1 day | about 6 hours | about 2 hours |
| Plus or minus 5% | about 6 days | about 1.5 days | about half a day |
| Plus or minus 10% | about 25 days | about 6 days | about 2 days |
| Plus or minus 20% | about 3 months | about 25 days | about 8 days |
These are average times for a price with no trend. Each is the distance to either edge divided by the typical daily move, squared, in days. A trend gets you out sooner, and any single run can be much shorter or longer.
The pattern is the point. Halving the band roughly quarters how long it lasts, while only doubling what it earns per day in range. That asymmetry is why very tight bands so often need more re-centring than people expect[5].
What you are actually maximising
In plain terms: fees earned while in range, minus the cost of every re-centre, minus what the position gives up to price movement.
Where:
- is what the same money would earn in fees across the full price range, after any protocol fee.
- is the efficiency multiple from the width.
- is the fraction of the period you are in range.
- is how many times you re-centre.
- is what one re-centre costs.
- is the divergence you take on against holding.
Every term can be estimated before you start. The multiple and the time in range pull against each other. The re-centring cost rises as the band narrows, because you re-centre more often.
The divergence term grows with the multiple too. For a price with no trend, its expected size is about C × t × σ²/8 a year, where σ is annual volatility[4]. So the width multiplies the fees and the divergence by the same factor. That makes the comparison of F against σ²/8 the first thing to check, before any choice of width.
Four strategies, none needing a forecast
A wide band you leave alone. Set it to two or three months of expected movement and leave it. Low income per dollar, usually in range, and one or two transactions a quarter. Suits smaller positions and anyone who will not monitor.
A band scaled to volatility. Roughly two standard deviations of expected movement over your intended period, re-centred only when the price actually leaves. Suits medium positions on liquid pairs.
Two bands. Split between a wide base and a narrow band near the price. The base keeps earning when the narrow one leaves its range, which takes the urgency out of each rebalancing decision.
One-sided. Place everything on one side of the price to buy or sell gradually across a chosen band. See Single-Sided Liquidity.
None of these requires knowing where the price is going. All of them require an honest estimate of volatility and of how much attention you actually have. The same strategies run on any venue with v3-style ranges, such as PancakeSwap liquidity pools on BNB Chain.
Rebalancing rules that hold up
Decide these before you mint, not while watching a chart.
- Trigger on exit plus time. Re-centre only after the price has been outside for a defined period, which filters out brief spikes.
- Require a payback test. Expected fees in the new band must exceed the full cost of moving, including the swap.
- Cap the frequency. Work out from your cost per cycle how many re-centres a month your expected fees can carry, and treat that as a hard limit. A cap prevents reactive churn in choppy markets.
- Widen rather than chase. If volatility has risen, widen. Re-centring at the same width just repeats the exit.
- Have a stop. Write down what would end the strategy: volume drying up, volatility this tier cannot support, or a measured shortfall against holding.
Uniswap’s own risk guidance lists both out-of-range time and the network cost of managing a range[3]. See Out-of-Range Liquidity for what to check when a position does exit.
A width decision, worked
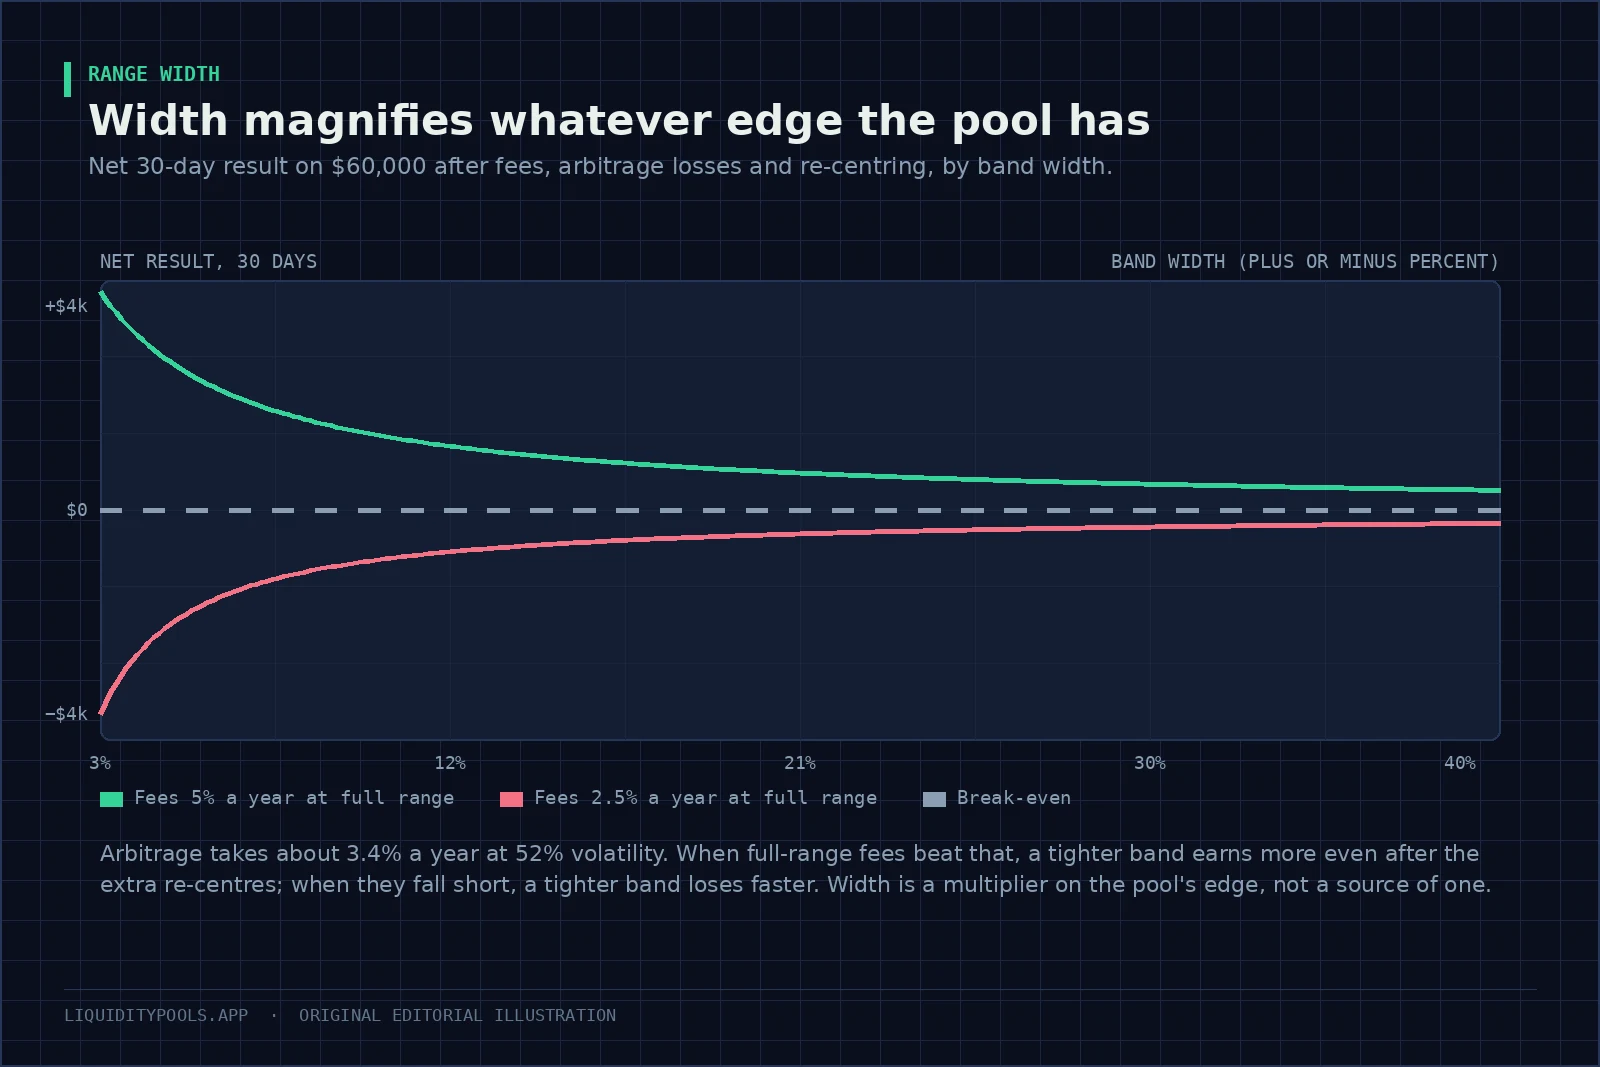
$60,000 into ETH against dollars at the 0.05% tier, for 30 days. Volatility is 52% a year, about 2.7% a day. Gas is $14 a transaction. Each re-centre takes two transactions and swaps half the position, paying the 0.05% fee on $30,000.
To keep the arithmetic simple, assume you re-centre as soon as the price leaves, so both bands are in range all month. Losses to arbitrage on a full-range position are 0.52 × 0.52 ÷ 8, about 3.4% a year[4].
| Plus or minus 15% | Plus or minus 5% | |
|---|---|---|
| Efficiency multiple | about 14x | about 40x |
| Expected days before touching an edge | about 30 | about 3.4 |
| Re-centres in the month | about 1 | about 9 |
| Gas and swap costs for the month | about $71 | about $415 |
Now try two assumed fee levels for a full-range position, one below and one above that 3.4% cost:
| Full-range fee yield | Plus or minus 15%, net for the month | Plus or minus 5%, net for the month |
|---|---|---|
| 2.5% a year | about −$670 | about −$2,170 |
| 5% a year | about +$1,030 | about +$2,820 |
Where the fees do not cover what arbitrage takes, the narrow band loses about three times as fast. Where they do, the narrow band wins even after nine re-centres. The width magnifies whatever edge the pool has.
Size changes the answer. At $6,000 with the 5% fee yield, gas eats most of the narrow band’s extra income: it nets about $30 against about $52 for the wide band. A 2021 study of large v3 pools found that, in aggregate, providers’ impermanent loss — their shortfall against simply holding — exceeded their fees[6], so do not assume you are in the second row. Studies of individual positions also find that the larger returns came with more risk and active management[2].
If you use an automated manager
Vaults handle the monitoring, re-centring and compounding. They charge a fee and add a contract.
| What they solve | What they do not |
|---|---|
| The operational burden | The rule itself may not match your view |
| Gas efficiency, through batching | Frequent re-centring in choppy markets locks in losses repeatedly |
| Consistent execution | A manager paid on assets has more reason to grow than to beat holding |
If you use one, judge it exactly as you would judge yourself: net result against holding the two tokens, after fees, on your own data.
Setting a range, step by step
- Compute seven-day and thirty-day volatility for the pair.
- Check fees against arbitrage cost. Compare the pool’s full-range fee yield with volatility squared divided by eight.
- Choose your holding period before you choose a width.
- Set the band to about two standard deviations of movement over that period.
- Compute the multiple and the expected time in range for that width.
- Estimate the number of cycles and what each costs at your size.
- Compute what you hold at both bounds, and confirm you accept both[1].
- Write the rebalancing rule and the stop rule down before minting.
The width that looks best on a spreadsheet is often narrower than the width that survives a month of real prices. Choose for the second one.
Test your width next
Try a candidate band in the concentrated liquidity calculator, which reports the efficiency multiple and what you hold at each bound. For the bin-based version of the same decision, see Meteora DLMM Strategy. For the tick-based version on Solana, see Raydium Liquidity Pools.
References
- Uniswap v3 Core Whitepaper (Adams et al., 2021)
- Risks and Returns of Uniswap V3 Liquidity Providers (Heimbach et al., 2022)
- What are the risks when providing liquidity? (Uniswap Labs)
- Automated Market Making and Loss-Versus-Rebalancing (Milionis et al., 2022)
- Strategic Liquidity Provision in Uniswap v3 (Fan et al., 2021)
- Impermanent Loss in Uniswap v3 (Loesch et al., 2021)
- Concentrated Liquidity | Uniswap Developers
- Ethereum gas and fees: technical overview | ethereum.org
Frequently asked questions
How wide should a liquidity range be?
Wide enough that the position stays in range through normal movement in the pair, which means scaling the band to realised volatility rather than to a target yield. A common starting point is one to two standard deviations of expected price movement over the period you intend to hold without adjusting.
Is a narrow range better for earning fees?
It earns more per dollar while price is inside it and nothing when price is outside. It also loses value to arbitrage faster while in range, by the same multiple. A narrow range magnifies whatever edge the pool has: helpful if fees exceed what arbitrage takes, harmful if they do not.
How often should I rebalance a concentrated position?
As rarely as the strategy allows. Each rebalance locks in the current token mix and pays gas plus swap costs, so the trigger should be a rule tied to expected fee income in the new range rather than a reaction to price.
What is a good time in range percentage?
There is no universal figure. What matters is whether fees earned while in range, minus losses to arbitrage, cover the cost of the re-centres needed to stay there. Measure time in range on your own positions rather than assuming it.
Should I use an automated range manager?
It removes the operational burden and adds a contract plus a fee. Automated managers rebalance on rules that may not match your view, and frequent re-centring in choppy markets locks in divergence repeatedly.
Continue in this track
This is guide 7 of 17 in LP Mechanics.
Next: Out-of-Range Liquidity: Why an LP Position Stops Earning Fees →
Previous: ← Uniswap v3 Ticks and Position NFTs Explained
See the full track sequence, or browse all 59 guides.