A formula rarely changes anyone’s mind. Five positions with real dollars make the shape obvious in a way the algebra does not.
Small moves cost you almost nothing. Large moves cost a great deal. What we are measuring is impermanent loss — what you give up by keeping your tokens in a pool instead of in a wallet — and in every case the fee line decides whether it mattered. Fees are not guaranteed to be big enough[7].
Each example below uses an even deposit in an ordinary constant-product pool, the kind that keeps its two balances multiplied to a fixed number[1]. Arbitrage traders keep its price in line with the wider market[8], so the outcome depends only on where the price goes. Each one then tells you what the fees would have had to be to break even.
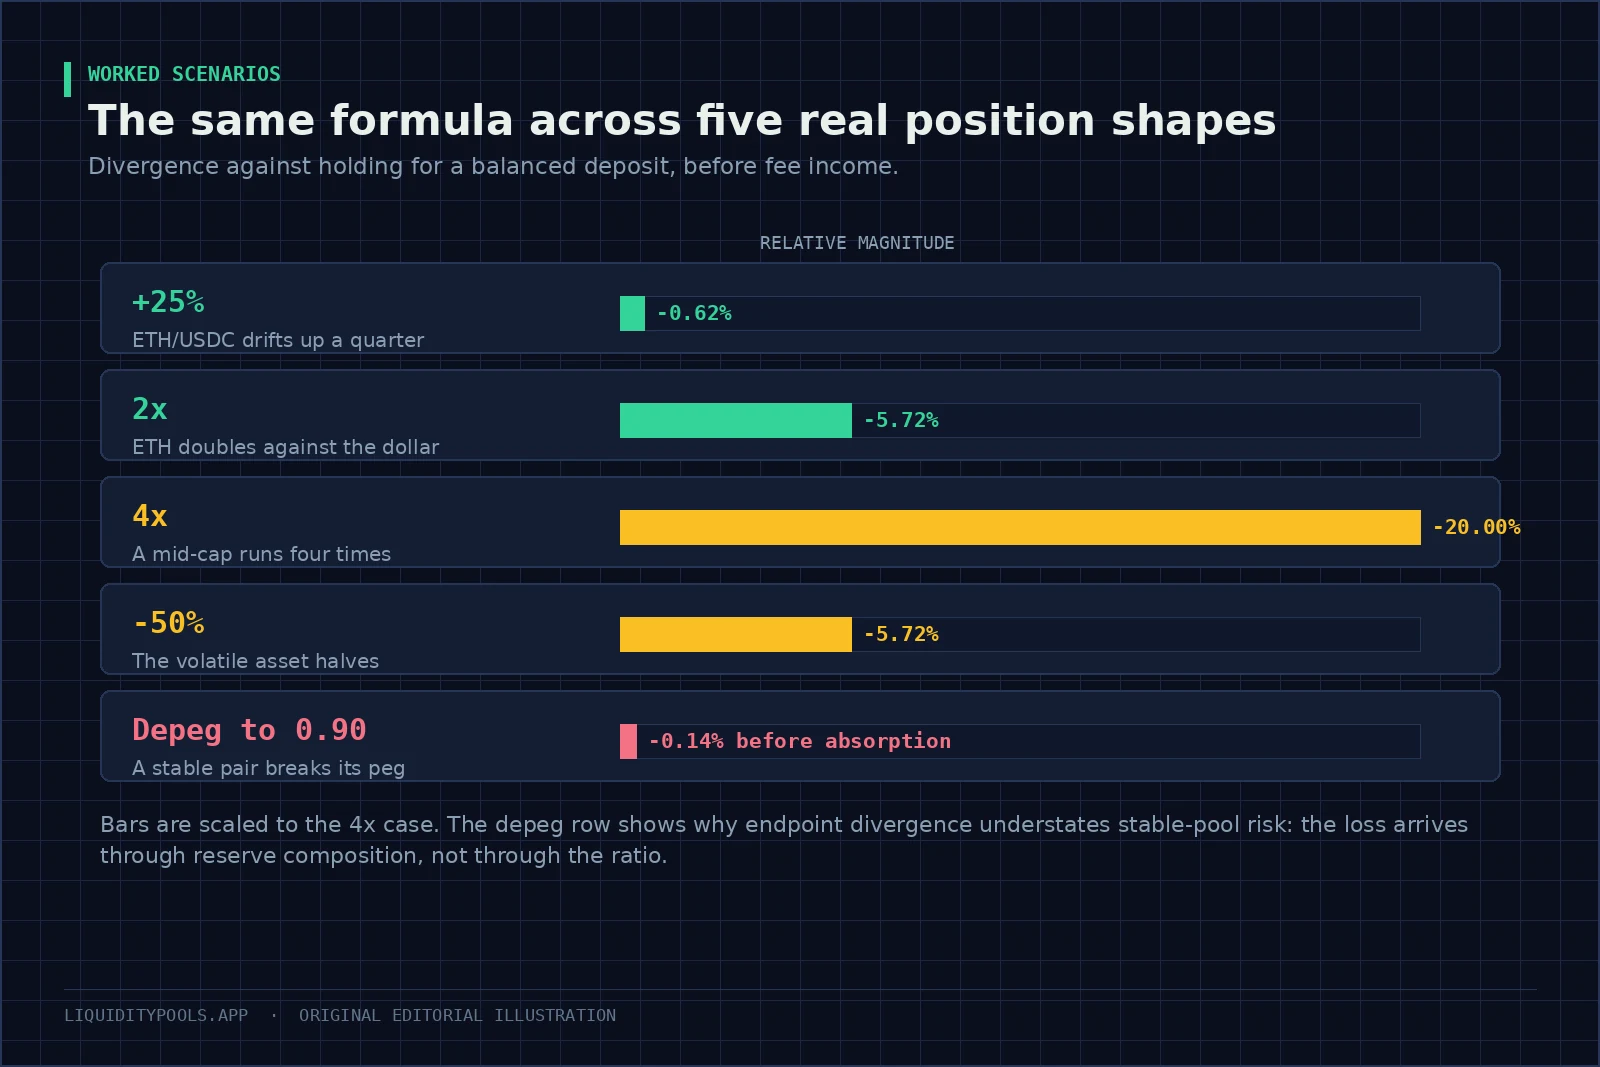
Key point: Many people guess that a four-times move costs a few percent. It costs twenty. The function is flat enough near the middle that intuition trained on small moves fails badly in the tail, which is exactly where the sizing decisions get made.
One: a modest drift
You deposit $10,000 into ETH against dollars at $2,000 per ETH, so 2.5 ETH and $5,000.
ETH rises to $2,500. A 25% move.
| Value | |
|---|---|
| Holding would be worth | $11,250 |
| The pool position is worth | $11,180 |
| The gap | -$70, or -0.62% |
| Fees needed to break even | $70 |
At the 0.05% tier, if a day’s volume equals the pool’s liquidity, a $10,000 full-range position earns about $5 a day, before any protocol fee. On those assumptions $70 is about two weeks of income. This is the regime where pools work comfortably, and where a pair that mostly drifts spends most of its life.
Two: it doubles
You deposit 1 ETH and $2,000 at $2,000 per ETH. A $4,000 basket.
ETH reaches $4,000. The pool rotates you to 0.7071 ETH and $2,828.
| Value | |
|---|---|
| Holding would be worth | $6,000 |
| The pool position is worth | $5,657 |
| The gap | -$343, or -5.72% |
| Fees needed to break even | $343 |
Read both numbers. You are up $1,657 in dollars and behind holding by $343. Both are true at the same time, and confusing them is a common misreading of a pool result. See The Impermanent Loss Formula.
Three: a four-times run
You deposit $20,000 split between a mid-cap token and dollars at $5.00, so 2,000 tokens and $10,000.
The token reaches $20.00. The pool rotates you to 1,000 tokens and $20,000.
| Value | |
|---|---|
| Holding would be worth | $50,000 |
| The pool position is worth | $40,000 |
| The gap | -$10,000, or -20.00% |
| Fees needed to break even | $10,000 |
Breaking even needs fees equal to half the deposit, earned during the run. Few pools produce anything close to that.
What actually occurred is simple: the pool sold half your winner on the way up. Researchers studying Uniswap v3 put it bluntly: on coins that rally hard, the so-called impermanent loss is often anything but impermanent[5]. If your thesis was that this token would run, a pool was the wrong instrument for holding it.
Four: it halves
The same $20,000 basket at $5.00.
The token falls to $2.50.
| Value | |
|---|---|
| Holding would be worth | $15,000 |
| The pool position is worth | $14,142 |
| The gap | -$858, or -5.72% |
| Fees needed to break even | $858 |
Notice the symmetry with example two. Exactly 5.72% again, because the formula only cares about distance, not direction.
Now notice what actually dominates. Measured against cash, holding the basket fell from $20,000 to $15,000: that $5,000 is the market. Measured against holding, the pool cost a further $858. Blaming the whole loss on impermanent loss misidentifies the problem. Picking that pair cost about six times what the pool mechanics did.
Five: a stablecoin breaks
You deposit $50,000 into a flat stable-pair pool, split evenly between two dollar tokens.
One of them trades to $0.90 and stays there.
Computed from the endpoint ratio alone, this looks trivial: about -0.14%. That number badly understates it, and here is why.
A stable curve holds the price near par while the balances skew, and only behaves like an ordinary pool once they are badly imbalanced[3]. By the time the pool’s quote reaches $0.90, it holds far more of the broken token than the good one.
The figures below assume a two-token StableSwap pool with an amplification setting of 100, arbitraged until its price matches $0.90, before fees.
| Roughly | |
|---|---|
| What the pool holds afterwards | About 93% the broken token |
| Marked at $0.90 | About $45,700 |
| Against holding an even basket, worth $47,500 | About -$1,800, or -3.9% |
| Against the $50,000 you started with | About -$4,300 |
| Fees over the same window | A few hundred dollars, assumed |
The lesson: on curves designed to resist ratio changes, the ratio-based formula understates the risk badly. The exposure lives in the composition, not the endpoint. See Stablecoin Liquidity Pools.
How fast the fees had to arrive
The dollar gap is only half the story. The other half is how long the move took, because fees accrue with time and divergence does not wait for them.
| Example | Gap as a share of the deposit | Fee rate needed if the move took 30 days | If it took a year |
|---|---|---|---|
| One, up 25% | 0.7% | about 8.5% a year | 0.7% a year |
| Two, doubles | 8.6% | about 104% a year | 8.6% a year |
| Three, four times | 50% | about 608% a year | 50% a year |
| Four, halves | 4.3% | about 52% a year | 4.3% a year |
The same move is easy to cover spread over a year and hard to cover packed into a month. So a quoted fee rate only means something next to how fast the pair actually moves. Before you compare two pools on their rates, check how quickly each pair has moved over the last few months. A pool paying 30% a year on a pair that can double in a month is not paying you enough, however generous 30% sounds.
The same five, in a narrow band
Everything above assumes a full-range position. A band changes two things. Inside it, the loss grows faster, because your money is concentrated there[6]. Past the edge, you hold only one token and stop rotating[2], and you stop earning fees[4]. The market keeps moving without you, so the shortfall against holding keeps growing.
Take example two again, ETH going from $2,000 to $4,000, but in a band.
| Structure | Shortfall when ETH reaches the band’s top | Shortfall when ETH reaches $4,000 | What you hold at $4,000 |
|---|---|---|---|
| Full range | No edge | -5.7% | 0.71 ETH and $2,828 |
| Plus or minus 40% | -7.6% at $2,800 | -23.6% | Only dollars |
| Plus or minus 10% | -2.3% at $2,200 | -30.7% | Only dollars |
The narrow band looks mild at its edge and finishes far behind. Every dollar of the run from $2,200 to $4,000 happened after the band had already sold your ETH. A tool that stops measuring at the edge hides this, so always compare against holding at today’s price. You can rerun the narrow case in the impermanent loss calculator’s range mode.
That gap is the subject of Out-of-Range Liquidity, and it is why narrow bands on trending pairs so often disappoint.
Fees partly compensate, because a narrow band earns much more per dollar while you are inside it. Whether they compensate enough depends on how long the price stayed there, which you can estimate in advance from how much the pair actually moves.
What all five have in common
- It is small until it is not. Below a 25% move it stays under 0.62%. At three times it is 13.4%, and it keeps accelerating.
- Your benchmark is the basket, not cash. Examples two and four have identical divergence and opposite dollar outcomes.
- Fees are the only offset actually paid to you. Everything else is a different exposure or a different instrument.
- The curve decides where the risk lives. Flat curves move it out of the ratio and into the composition, where the usual formula cannot see it[3].
- The decision happens at deposit, not at exit. Every number above was computable in advance from a price assumption.
Run your own position through the impermanent loss calculator, then check whether the fees clear it with the liquidity pool fee and APR calculator. For what each mitigation costs, see How to Avoid Impermanent Loss. The arithmetic behind every table above is derived step by step in The Impermanent Loss Formula, and fees are set against that shortfall in LP Fees vs Impermanent Loss.
References
- Uniswap v2 Core Whitepaper (Adams et al., 2020)
- Uniswap v3 Core Whitepaper (Adams et al., 2021)
- StableSwap: efficient mechanism for Stablecoin liquidity (Egorov, 2019)
- What are the risks when providing liquidity? (Uniswap Labs)
- Impermanent Loss in Uniswap v3 (Loesch et al., 2021)
- Risks and Returns of Uniswap V3 Liquidity Providers (Heimbach et al., 2022)
- DeFi risks and the decentralisation illusion (Aramonte, Huang & Schrimpf, BIS Quarterly Review, December 2021)
- An analysis of Uniswap markets (Angeris et al., 2019)
Frequently asked questions
Can you show a simple impermanent loss example?
Deposit 1 ETH and 2,000 USDC at 2,000 per ETH, a 4,000 dollar basket. If ETH doubles to 4,000, holding is worth 6,000 while the pool position is worth 5,657. The 343 dollar gap is a 5.72% impermanent loss, which fee income may or may not cover.
What is impermanent loss at 50%, 2x, and 4x?
A halving and a doubling each produce a 5.72% shortfall against holding, because the formula is symmetric in log price. A four-times move produces 20.0%, and a five-times move 25.5%.
Is impermanent loss the same as losing money?
No. It measures performance against holding the deposited basket, not against your starting currency. A position can be up in dollar terms and still show impermanent loss, or down in dollars with no impermanent loss at all if both assets fell equally.
When does impermanent loss become permanent?
When you withdraw at a price ratio different from your entry ratio. Until then, the gap closes if relative prices return to where they started, which is the whole reason the word impermanent is used.
Continue in this track
This is guide 5 of 16 in Risk & Research.
Next: How to Avoid Impermanent Loss (and What Each Method Costs) →
Previous: ← The Impermanent Loss Formula: How to Calculate IL Step by Step
See the full track sequence, or browse all 59 guides.