Impermanent loss — the shortfall of a pool position against the same tokens left in a wallet — is not a fee, and nobody charges it. It is arithmetic: the pool kept trading your tokens while the market moved, and the wallet did not.
The formula for that gap is one line and it has exactly one input. You can work out your own number in about a minute.
By the end you will be able to compute it for your own position, check it against what you actually withdrew, and know the cases where the formula on its own gives the wrong answer.
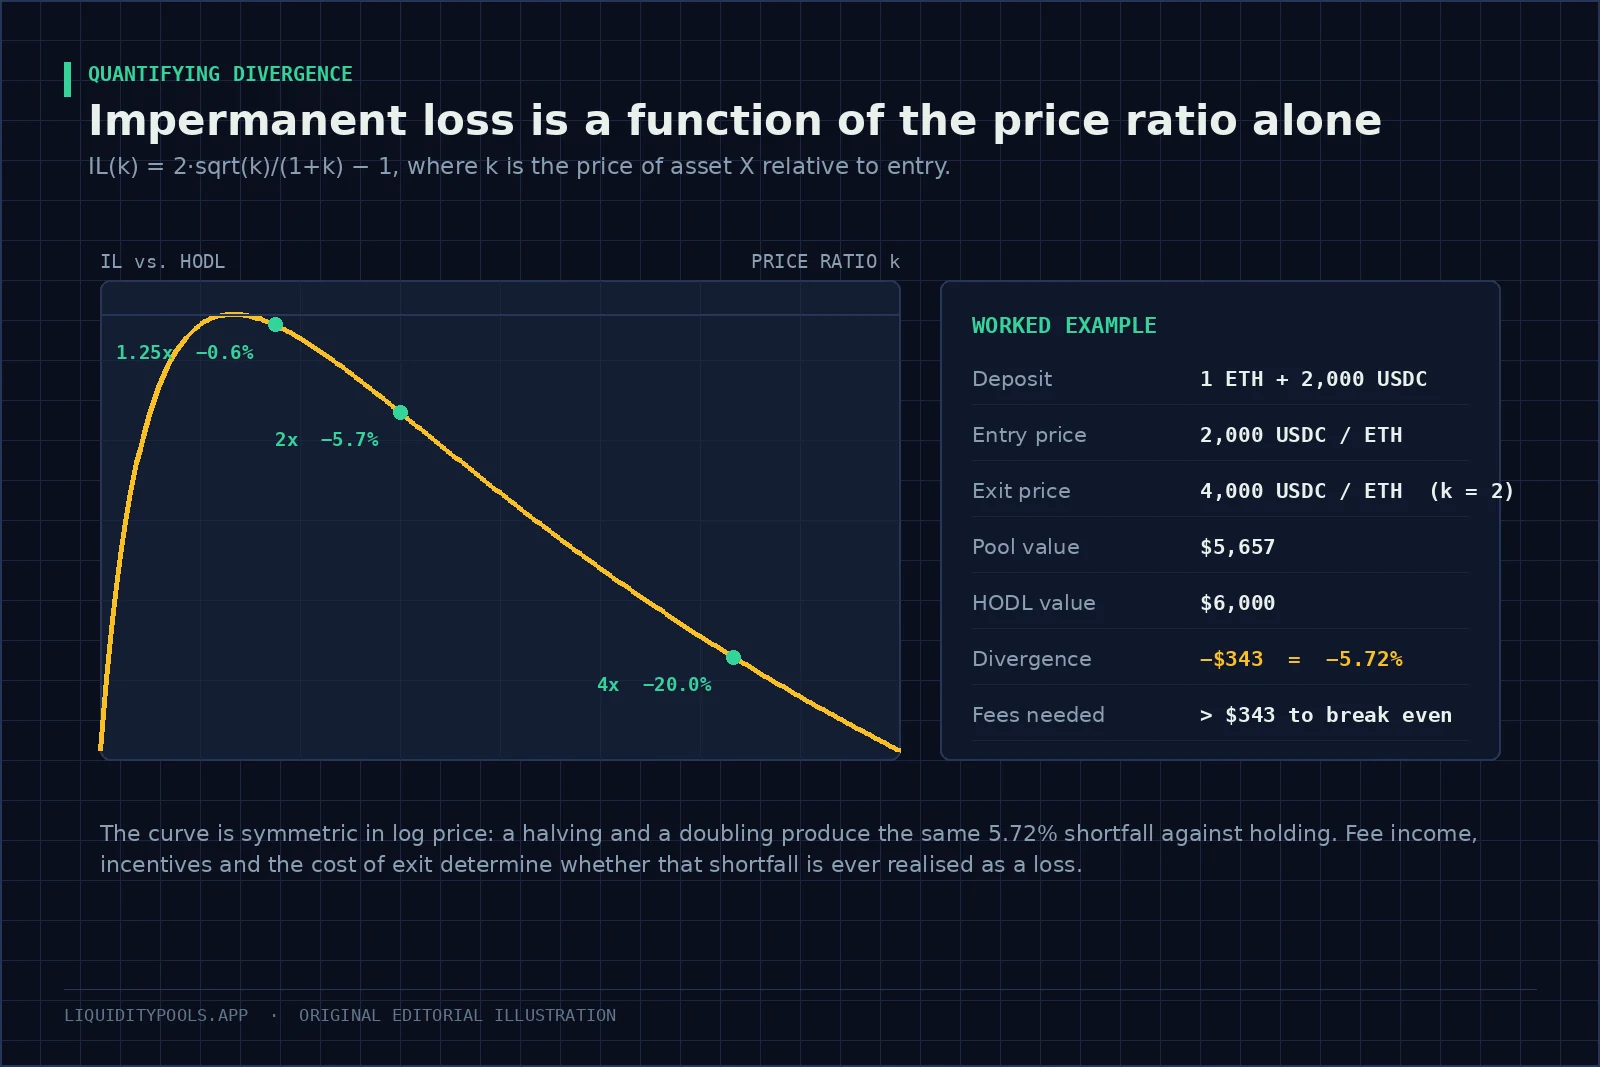
Key point: Everyone can recite that a doubling costs 5.7%. Almost nobody can give you the number for their own position, because it was minted at three different prices, collected fees in two tokens, and paid gas twice. The formula is the easy part. Keeping records good enough to use it is the hard part.
Where the formula comes from
A pool holds two tokens and keeps their product at a fixed number[2]. Price is one balance divided by the other.
You deposit at some price. The market moves. Arbitrage traders keep pulling the pool’s price back in line with the market[6], and that completely determines what the pool ends up holding.
Define one number, the price ratio , where is the price when you deposited and is the price now. A doubling gives ; a halving gives .
Because the product stays fixed and price is the ratio, the new balances are the old ones divided and multiplied by the square root of . Value the pool position at the new price, value the untouched basket at the same price, take the ratio, and everything cancels into one line[5]:
Where:
- is the price ratio above.
- The answer is negative, and it is the fraction by which the pool trails simply holding.
Three things fall out of it immediately, and all three are worth holding onto.
- It is never positive. The only case where it is zero is , meaning the price came back exactly.
- Direction does not matter. Halving and doubling cost exactly the same. Only distance matters.
- Only the relative price counts. If both tokens fall 40% together, this formula says zero, because the pool did no rotating. You lost money, but not to the pool. The benchmark is always holding the same basket, not holding cash[5].
The mechanism behind all of it is in Impermanent Loss Explained.
The table worth memorising
| Price ratio | What that means | Shortfall against holding | What the pool did |
|---|---|---|---|
| 0.25 | Down 75% | -20.00% | Doubled its holding of the falling token |
| 0.50 | Down 50% | -5.72% | Bought about 41% more of it |
| 0.80 | Down 20% | -0.62% | Bought about 12% more |
| 1.00 | Flat | 0.00% | Nothing |
| 1.25 | Up 25% | -0.62% | Sold about 11% |
| 1.50 | Up 50% | -2.02% | Sold about 18% |
| 2.00 | Doubled | -5.72% | Sold about 29% of it |
| 4.00 | Up 4x | -20.00% | Sold half of it |
| 5.00 | Up 5x | -25.46% | Sold about 55% of it |
An ordinary pool, once arbitrage has caught up, always keeps half its value in each token[5]. What changes is how many of each it holds.
The shape is the lesson, not the individual rows. Small moves cost almost nothing. Past a doubling it accelerates hard. That is the whole reason pegged pairs and volatile pairs behave so differently on the same curve. Each row is worked through as a full position in dollars in Impermanent Loss Examples.
A real position, start to finish
Deposit into an ETH/USDC pool at $2,000 per ETH.
- What goes in: 1 ETH and $2,000 of USDC, $4,000 total, an even split.
- Price at exit: $4,000 per ETH, so .
Step one, what holding would have been worth. One ETH at $4,000 plus $2,000 of USDC comes to $6,000.
Step two, what the pool holds now. The balances rotate by the square root of 2. You now have 0.7071 ETH and $2,828 of USDC. At the new price that is $5,657.
Step three, the gap. $5,657 divided by $6,000, minus one, is -5.72%. In dollars, -$343. Exactly what the table said.
Step four, the part that actually decides it. Say the position earned $420 in fees over that period. You are ahead of holding by $77, about 1.3% of the held basket’s value.
That last step is the whole game. The position was profitable and it beat holding, but only because the fees cleared the gap with something to spare. Fees are not guaranteed to do that[7]. See LP Fees vs Impermanent Loss.
The version for range positions
A range position does not follow that curve, and the differences cut both ways[1].
Inside your band the divergence is larger than the formula says, roughly in proportion to how much your range multiplies your capital[5]. Outside the band the position has fully converted and stops trading, but the market keeps moving without you.
Where:
- is how much of the risky token the position holds at price .
- is your liquidity size.
- is the top of your band.
- The formula applies while is inside the band.
Read the shape. As rises toward , the two terms converge and your holding of the risky token goes to zero. You have sold all of it, and the selling stops there.
Stopped selling is not the same as stopped losing. Take a band from $1,800 to $2,200, opened with ETH at $2,000. When ETH reaches $2,200 the position is 2.3% behind holding. If ETH carries on to $4,000, it is 30.7% behind, against 5.7% for a full-range position, because the whole rest of the move happened without you. Always measure against holding at today’s price, not at the edge of your band. See Out-of-Range Liquidity.
What the formula ignores on purpose
Run the number on its own and you will get a misleading answer, in either direction.
- Fees. The entire reason to be there, and not in the formula at all.
- Token rewards. Value them at the price you could actually have sold them, not the price on the day they accrued.
- Gas. Minting, claiming, re-ranging and withdrawing. On a small position this can be the whole result[3].
- Time spent out of range. A range position outside its band earns no fees while staying fully exposed[3].
- Entry and exit costs. Price impact — how far your own order moves the rate — and slippage, the gap between quote and fill, both apply when a large deposit has to be swapped into the right ratio first. See Slippage and Price Impact.
- The cost of volatility along the way. A pool that ran to 3x and came back shows zero here, which is accurate against holding. It says nothing about the steady cost that volatility created, which is what the fees were meant to cover. That cost is measured by loss-versus-rebalancing — the amount a pool gives up to arbitrage because its quote trails the market — rather than by this formula[4].
How to compute your own number
- Write down where you started. Quantities, both prices, the time, the transaction hash. Without this you cannot reconstruct anything later.
- Value holding at the exit price, not at some high point you remember.
- Apply the formula, then check it against what you actually withdrew. On Uniswap v2, fees are added to the pool’s reserves, so they show up inside what you withdraw; on v3 and v4 they are collected separately[8]. A mismatch usually means fees were mixed into the balances.
- Add fees in the same units, at the prices you actually got.
- Subtract all the friction. Gas, swap costs, and any exit fee a vault or hook charges.
- Compare against what you could really have done. Holding the basket, holding one token, or a different pool. A benchmark you never had access to is not a benchmark.
- Check it against independent accounting. Revert Finance rebuilds position history and separates fees from divergence.
Use this before you deposit, not after you are disappointed. Run at deposit time with an honest view of how much the pair moves and how much the pool earns, it tells you how far the price can move before the fees stop covering the gap. The structural levers for keeping that number small — pair choice, range width, holding period — are collected in How to Avoid Impermanent Loss.
Where to go next
Run your own numbers through the impermanent loss calculator, then check whether fees cleared the gap using LP Fees vs Impermanent Loss.
References
- Uniswap v3 Core Whitepaper (Adams et al., 2021)
- Uniswap v2 Core Whitepaper (Adams et al., 2020)
- What are the risks when providing liquidity? (Uniswap Labs)
- Automated Market Making and Loss-Versus-Rebalancing (Milionis et al., 2022)
- Impermanent Loss in Uniswap v3 (Loesch et al., 2021)
- An analysis of Uniswap markets (Angeris et al., 2019)
- DeFi risks and the decentralisation illusion (Aramonte, Huang & Schrimpf, BIS Quarterly Review, December 2021)
- Fees (Uniswap Developer Documentation)
Frequently asked questions
What is the impermanent loss formula?
For a two-asset constant-product pool, IL(k) = 2·√k / (1 + k) − 1, where k is the current price of one asset divided by its price at deposit, measured in units of the other asset. The result is negative and expresses the shortfall of the pooled position against simply holding the deposited basket.
How do I calculate impermanent loss on a real position?
Take the price ratio between exit and entry, apply the formula to get the percentage shortfall, then multiply by the value the basket would have had if held. Subtract fees earned to get the net result. A 2x move produces a 5.72% shortfall, a 4x move 20.0%, and a 5x move 25.5%.
Is impermanent loss ever permanent?
It becomes permanent the moment you withdraw at a price ratio different from your entry ratio. Until then it is an unrealised gap against a hold benchmark that closes if relative prices return to where they started.
Does the formula work for concentrated liquidity?
Not directly. Inside its band a range position diverges faster, roughly in proportion to its capital-efficiency multiplier. Once price leaves the band the position holds a single asset, so it stops rotating, but its shortfall against holding keeps growing as the price moves further. The article gives the holdings formula for a range position.
Continue in this track
This is guide 4 of 16 in Risk & Research.
Next: Impermanent Loss Examples: Five Positions, Fully Worked →
Previous: ← Impermanent Loss Explained: Why Pools Trail Simply Holding
See the full track sequence, or browse all 59 guides.