Supplying a pool is two things at once. You earn a steady trickle from trading, and you give some value away whenever the price moves. Whether you made anything comes down to which of those two lines was steeper.
Both lines can be measured. Neither one is the number on the pool page.
By the end you will have one inequality you can fill in for any pool before depositing, worked on a real position, and you will see why the earning side has a ceiling while the cost side does not.
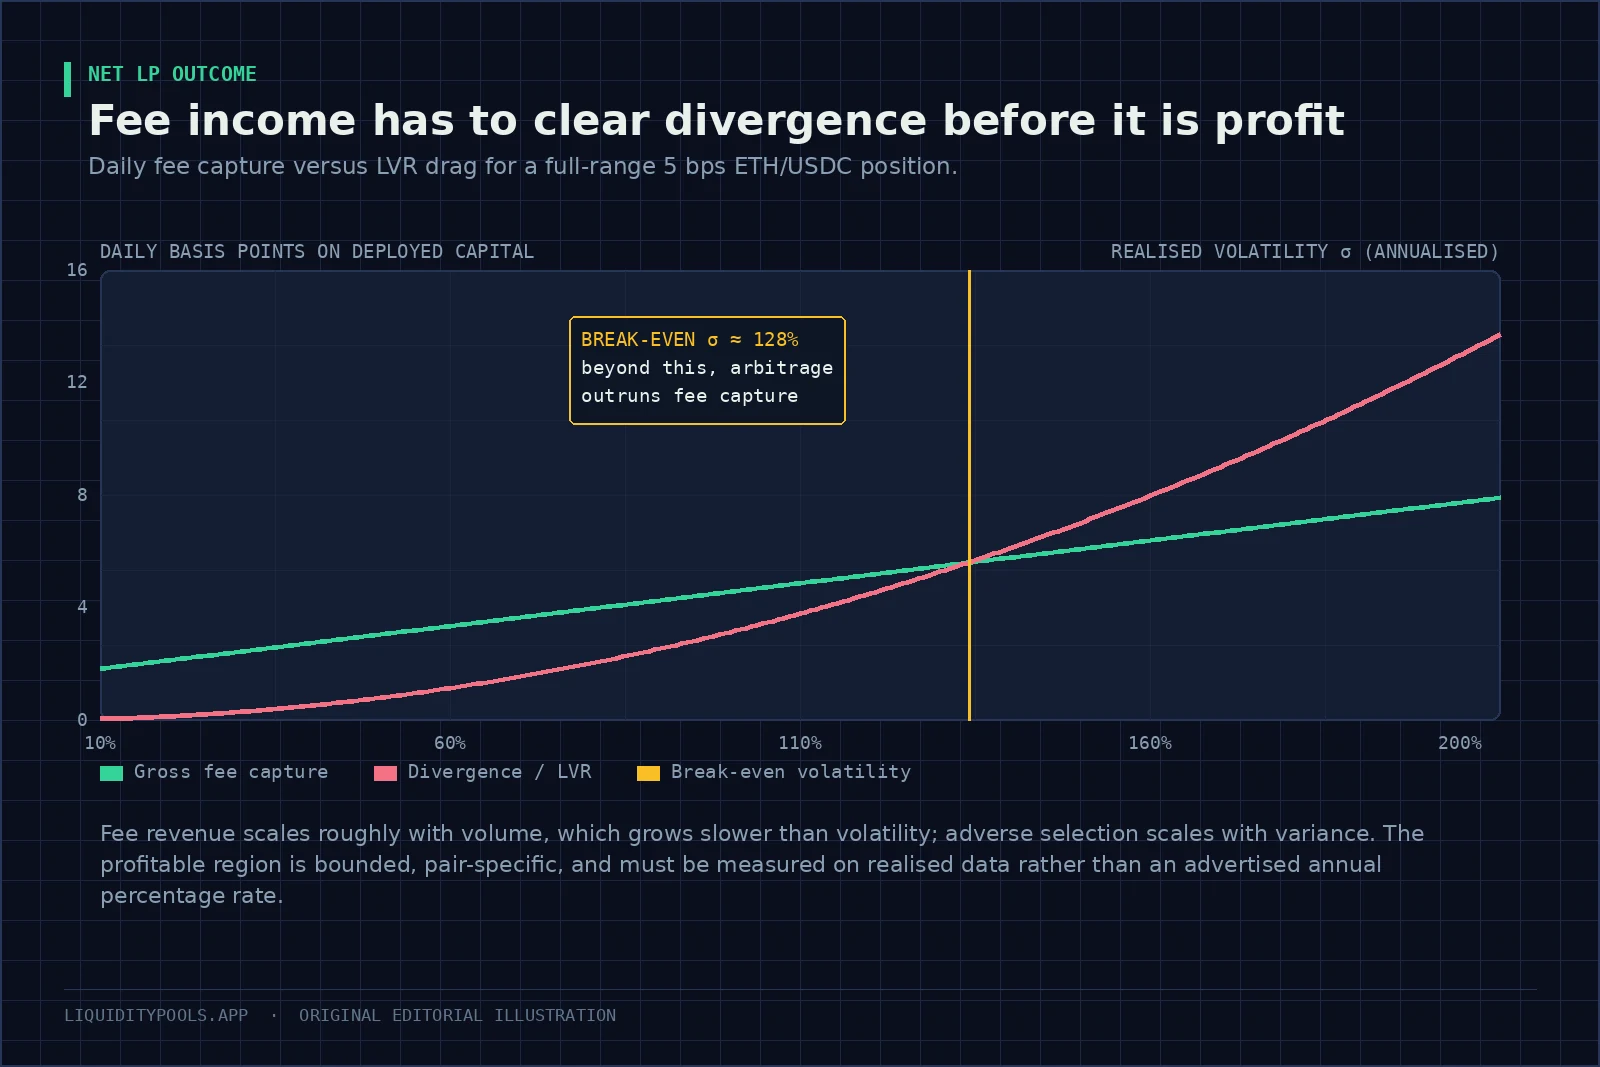
Key point: Evaluate hourly volume beside hourly volatility. Volume from uninformed demand can pay fees without the same selection cost as arbitrage that reprices a stale pool quote. The total volume number alone does not reveal which kind of flow the position served.
The two lines
Fee income is simple: .
- is the fee rate you actually keep, so 0.05% means 0.0005. On Uniswap pools where the protocol fee is switched on, providers keep three quarters of the 0.01% and 0.05% tiers and five sixths of the 0.30% and 1% tiers[8].
- is the volume that actually executed against your liquidity.
- is your share of the money working in that band while you were live.
The second term matters more than people think. Aggregators split orders across venues and tiers, and a position out of range earns none of it[1]. Use routed volume, not the pool’s headline number.
The other line is what leaves when your quote is stale. For a full-range position, it comes to a simple share of value[4]:
Where:
- is the pair’s annual volatility.
- The drag is the yearly share of the position’s value that arbitrage takes. A band multiplies it by how densely it packs your money.
The square is the whole story. Double how much a pair moves and this quadruples, and nothing makes the volume that pays you rise in step.
This is the frictionless version. With a fee, arbitrageurs only trade when the gap beats the fee, which trims what they take, and faster blocks trim it further[6]. Treat the formula as a conservative planning number, not a forecast.
The test that decides it
Put the two lines on the same daily footing and the question becomes one inequality:
Where:
- Turnover is daily routed volume divided by the liquidity backing it.
- and are the fee rate and annual volatility from above, and 365 turns the yearly cost into a daily one.
For a band, measure turnover against the money actually in the band and multiply the right side by the band’s packing factor. That inequality, not the advertised rate, is the whole question.
Working it on a real position
A $100,000 position at the 0.05% tier on ETH against dollars, in range the whole time, holding 2% of the liquidity in that band.
| Value | |
|---|---|
| Fee rate | 0.05% |
| Daily volume through your band | $40,000,000 |
| Your share of the liquidity there | 2.0% |
| Daily fees, gross | $400 |
| Daily fees if a 25% protocol share is switched on | $300 |
| Daily yield on your capital | 30 to 40 basis points |
| Pair’s annual volatility | 60% |
| Drag on a full-range position | about 1.2 basis points a day |
| Your band, plus or minus 10%, multiplies that by | about 20 |
| Daily drag on your band, near its middle | about 25 basis points |
At 60% volatility this still clears. Thirty to forty basis points coming in, about twenty-five going out. That is a real margin, but a much thinner one than the fee number on its own suggests.
Now change one thing at a time and watch how differently the two sides behave.
| What changes | What happens to fees | What happens to the drag |
|---|---|---|
| Competition doubles the liquidity in your band | Halves, to 15 to 20 basis points | Unchanged |
| Volatility jumps to 150% | May rise, until the price leaves your band | Rises to about 160 basis points a day in this band |
| Volume dries up | Falls toward zero | Unchanged |
That is the asymmetry to remember. Your earning is capped by how many other people want the same trade. Nothing caps the cost side except volatility itself. The endpoint version of that cost — impermanent loss, how far the position trails just holding the tokens — is derived in The Impermanent Loss Formula. More positions worked this way are in Impermanent Loss Examples.
How much trading a pair needs
Turn the inequality around and it tells you the daily turnover a full-range position needs just to stand still, before gas, at the gross fee rate.
| Pair volatility | At the 0.05% tier | At the 0.30% tier |
|---|---|---|
| 40% a year | 0.11 times the liquidity, every day | 0.02 times |
| 80% a year | 0.44 times | 0.07 times |
| 120% a year | 0.99 times | 0.16 times |
Read the bottom left cell. A pair moving 120% a year at the 0.05% tier needs the whole pool’s liquidity to trade every single day to break even. Very few pools manage that for long. That is why volatile pairs tend to settle in higher tiers, and why a low tier on a volatile pair is usually a slow loss. Where a protocol fee applies, every cell rises by the same proportion.
Why the endpoint measure is not enough
Impermanent loss compares where the price started with where it ended. It says nothing about the journey.
Take a pair that starts at $2,000, runs to $3,000, and comes back to $2,000 inside a week. The endpoint measure says zero, and against simply holding that is right, plus the fees you earned.
But the fees were meant to pay you for standing in the market, and every leg of that path was traded against a pool quoting the old price. Against somebody running the same exposure at market prices, you are behind by that path cost. Loss-versus-rebalancing — the amount a pool gives up because its quote trails the market — measures exactly that[4].
The practical version: judge a pool by whether its fees beat that cost over a full cycle, not by whether the price happened to come back. See Loss-Versus-Rebalancing.
How to check what actually happened
- Your position against holding: Revert Finance splits a position into fees, divergence, and net result. Most people run this far too late.
- Who you were trading with: EigenPhi attributes swaps to arbitrage and sandwiching. A pool where most volume is arbitrage is paying you to take the losing side.
- Realised rather than projected yield: DeFiLlama publishes fee and size series so you can compute what actually happened.
- How crowded your band is: Dune Analytics shows the liquidity distribution, and how fast it changes when a reward programme starts.
Look at a full cycle, not a fortnight. A quiet two weeks makes any pool look good, and one bad week makes any pool look ruinous.
What people get wrong in this comparison
| The mistake | Why it gives the wrong answer |
|---|---|
| Annualising a good day | Fee income clusters around events and then decays. It does not continue |
| Ignoring time out of range | The fees stop. The exposure does not, and neither does the denominator |
| Valuing reward tokens at the accrual price | They get sold into thin markets. What you actually realise is lower |
| Comparing against cash | The right benchmark is holding the two tokens, not holding dollars |
| Ignoring gas | On a small position, rebalancing can cost more than every fee you earn |
| Assuming stable pairs are safe | Small divergence until a peg breaks, then the curve fills you with the broken token |
Uniswap’s own risk page lists impermanent loss, positions that earn no fees once out of range, and the network cost of managing a range among the ways providers lose money[3]. A BIS review makes the same point from outside: trading fees may not be high enough to offset the loss[2].
Measured outcomes vary widely. A 2021 study of 17 Uniswap v3 pools counted $260.1 million of impermanent loss against $199.3 million of fees, with about half of providers showing negative returns[7], and another study found that the more volatile the pool, the more fee income a provider needs to compensate[5].
The decision, step by step
- Work out turnover. Daily routed volume divided by the liquidity actually in the active band. Not the pool’s total.
- Multiply by the fee rate you keep to get a daily yield in basis points.
- Work out the drag from trailing volatility, then raise it for a concentrated range.
- Compare, and demand a margin. Gas, competition for your band, and error in your volatility estimate all eat into it, so a thin margin on paper is often negative in practice.
- Set the exit rule now. A volatility trigger, a floor on time in range, or a drawdown limit against holding.
- Size for the friction. Work out how many days of fees one round trip of gas costs. If that is a large share of how long you plan to stay, the position belongs in a wide passive range instead.
See How to Evaluate a Liquidity Pool and The Liquidity Pool Research Checklist. For the structural ways to tilt this contest before it starts, see How to Avoid Impermanent Loss.
Where to go next
Model the income with the liquidity pool fee and APR calculator and the cost with the impermanent loss calculator; the LP profit and return calculator resolves both into one figure. For the tier decision underneath both, see Uniswap Fee Tiers Explained, and for the whole revenue-and-cost ledger on two worked positions, Is Providing Liquidity Profitable?.
References
- Uniswap v3 Core Whitepaper (Adams et al., 2021)
- DeFi risks and the decentralisation illusion (Aramonte, Huang & Schrimpf, BIS Quarterly Review, December 2021)
- What are the risks when providing liquidity? (Uniswap Labs)
- Automated Market Making and Loss-Versus-Rebalancing (Milionis et al., 2022)
- Risks and Returns of Uniswap V3 Liquidity Providers (Heimbach et al., 2022)
- Automated Market Making and Arbitrage Profits in the Presence of Fees (Milionis et al., 2023)
- Impermanent Loss in Uniswap v3 (Loesch et al., 2021)
- Fees (Uniswap Developer Documentation)
Frequently asked questions
Do trading fees cancel out impermanent loss?
Sometimes, and only in specific conditions. Fee income scales with trading volume, while the cost of providing liquidity scales with the square of volatility. On pairs where volume is high relative to volatility, fees clear the hurdle; on pairs where a sharp repricing arrives without a matching surge in routed volume, they do not.
How do I know if a liquidity position was profitable?
Compare the withdrawn value plus collected fees against the value of simply holding the deposited basket over the same window, then subtract gas and any swap costs. A position can be up in dollars and still have underperformed the basket it started from.
Is providing liquidity profitable on average?
Not reliably. A 2021 study of 17 large Uniswap v3 pools found impermanent loss exceeded fee income in aggregate and about half of providers had negative returns, and later work found arbitrage losses exceeding fees in many of the largest pools. Results depend on the pair, the fee tier, the range and the holding period, not on the pool being popular.
What volatility level makes a pool unprofitable for LPs?
There is no universal number. The condition is that daily fee yield must exceed the daily cost of arbitrage against the pool, which grows with the square of volatility. For a given fee tier and turnover you can solve for the volatility at which the two lines cross and treat that as the pair's hurdle.
Continue in this track
This is guide 7 of 16 in Risk & Research.
Next: Is Providing Liquidity Profitable? The Full Arithmetic →
Previous: ← How to Avoid Impermanent Loss (and What Each Method Costs)
See the full track sequence, or browse all 59 guides.