The honest answer is that it depends on numbers you can get before you deposit, and that almost nobody gets them.
This is not a property of liquidity provision as an activity. It is a property of one pool over one period, and it comes down to a single inequality that either holds or does not.
Below is that inequality, every term in it, and two positions worked end to end. One wins. One does not, and it is the one with the bigger fees. By the end you can fill the inequality in for a pool you are considering.
Key point: A position can be modelled correctly and still be scoped wrongly. Gas, time spent out of range, and a realistic value for reward tokens belong in the same ledger as fees. Omitting them can turn a positive quoted rate into a negative net result.
The inequality
A position beat holding when everything it earned is larger than everything it cost, with the costs measured against keeping the same tokens:
Where:
- is the trading fees you collected.
- is what you actually got for any reward tokens, after selling them.
- is how far you fell behind simply holding the two tokens.
- is gas and every other transaction cost.
- is what the same tokens would have earned in their next-best use, such as lending or staking them.
Nothing else belongs in there. The pool’s size is not in it. The protocol’s reputation is not in it. The advertised rate appears only as an optimistic estimate of the first term.
Where the fees actually come from
Your fee income is the volume that reached your pool, times the fee you keep, scaled by your share of the live liquidity and by how long you were in range:
Where:
- is the volume that actually routed through your pool.
- is the fee rate you keep. On Uniswap pools where the protocol fee is switched on, a quarter of the 0.01% and 0.05% tiers, or a sixth of the 0.30% and 1% tiers, goes to the protocol[7].
- is your share of the liquidity live at the traded price.
- is the fraction of the period your liquidity was active at all.
The last two are where estimates fall apart.
Your share is measured against live liquidity, not total deposits. Money parked in distant ranges earns nothing and does not dilute you[5]. Money crowded into your exact band dilutes you heavily. See Liquidity Depth and Execution and Onchain Liquidity Metrics.
Time in range is a straight multiplier, because a position out of range earns no fees[6]. Few people estimate it before depositing. A position earning a 60% annual rate while live, in range 40% of the time, earned 24%. See Out-of-Range Liquidity.
Here is how the fee rate and turnover interact:
| Fee tier | Typical use | Yearly fee yield, gross, at 1x daily turnover | At 4x |
|---|---|---|---|
| 0.01% | Stablecoin pairs | 3.7% | 14.6% |
| 0.05% | Stable-ish and very liquid major pairs | 18.3% | 73.0% |
| 0.30% | Most volatile pairs | 109.5% | 438.0% |
| 1.00% | Highly volatile or rarely traded tokens | 365.0% | 1,460.0% |
The tiers exist because one fee is too high for pairs of stablecoins and too low for highly volatile or rarely traded tokens[5]. Turnover means daily routed volume divided by the liquidity competing for it. The right column looks absurd because it is. Sustained 4x turnover at 0.30% does not last, because that much revenue attracts liquidity until your share collapses.
The table’s real use is directional. Fee income is governed by turnover, not by the tier. Turnover is what to research.
The deduction dashboards leave out
The shortfall against holding is impermanent loss — what the pool’s automatic rebalancing costs you compared with keeping the two tokens in a wallet — and you can compute it in advance:
Where:
- is the relative price of the two tokens now, divided by the relative price when you deposited.
A pair that diverges 2x costs 5.72% against holding. 4x costs 20.00%. Those figures are for a full-range position.
A narrow range amplifies it inside the band[1]. In practice it often outweighs fees: a study of 17 Uniswap v3 pools in 2021 counted $260.1 million of impermanent loss against $199.3 million of fees, with about half of providers showing negative returns[4].
The forward-looking version is loss-versus-rebalancing — the amount the pool hands to arbitrage every time its quote falls behind the market. It builds with volatility along the route the price takes, so you can estimate it before you deposit rather than waiting to see where the price ends[2].
The practical consequence: the endpoint number tells you what happened on one path. The rebalancing figure tells you what the pair costs on average, and it is highest in exactly the volatile pairs that advertise the highest rates. See Loss-Versus-Rebalancing.
Why position size decides it
Gas is a fixed cost per transaction, which makes it a variable cost per dollar you deposit. A managed position is not one transaction. It is two approvals, a mint, some claims, one or more rebalances, and a burn.
| Your position | 8 transactions at $9 | As a share of your capital |
|---|---|---|
| $500 | $72 | 14.4% |
| $2,500 | $72 | 2.9% |
| $10,000 | $72 | 0.7% |
| $50,000 | $72 | 0.1% |
At the bottom of that table it rounds to nothing. At the top it can exceed a year of fee income. That single table answers the most common version of this question. See LP Gas Costs.
The fourth deduction is reward tokens losing value. They accrue at one price and get realised at whatever survives everybody else selling the same issuance into the same market. Valuing them at the accrual price and calling it yield is a common error. See Yield Farming Explained and Real Yield in Liquidity Pools.
Two positions, ninety days, same operator
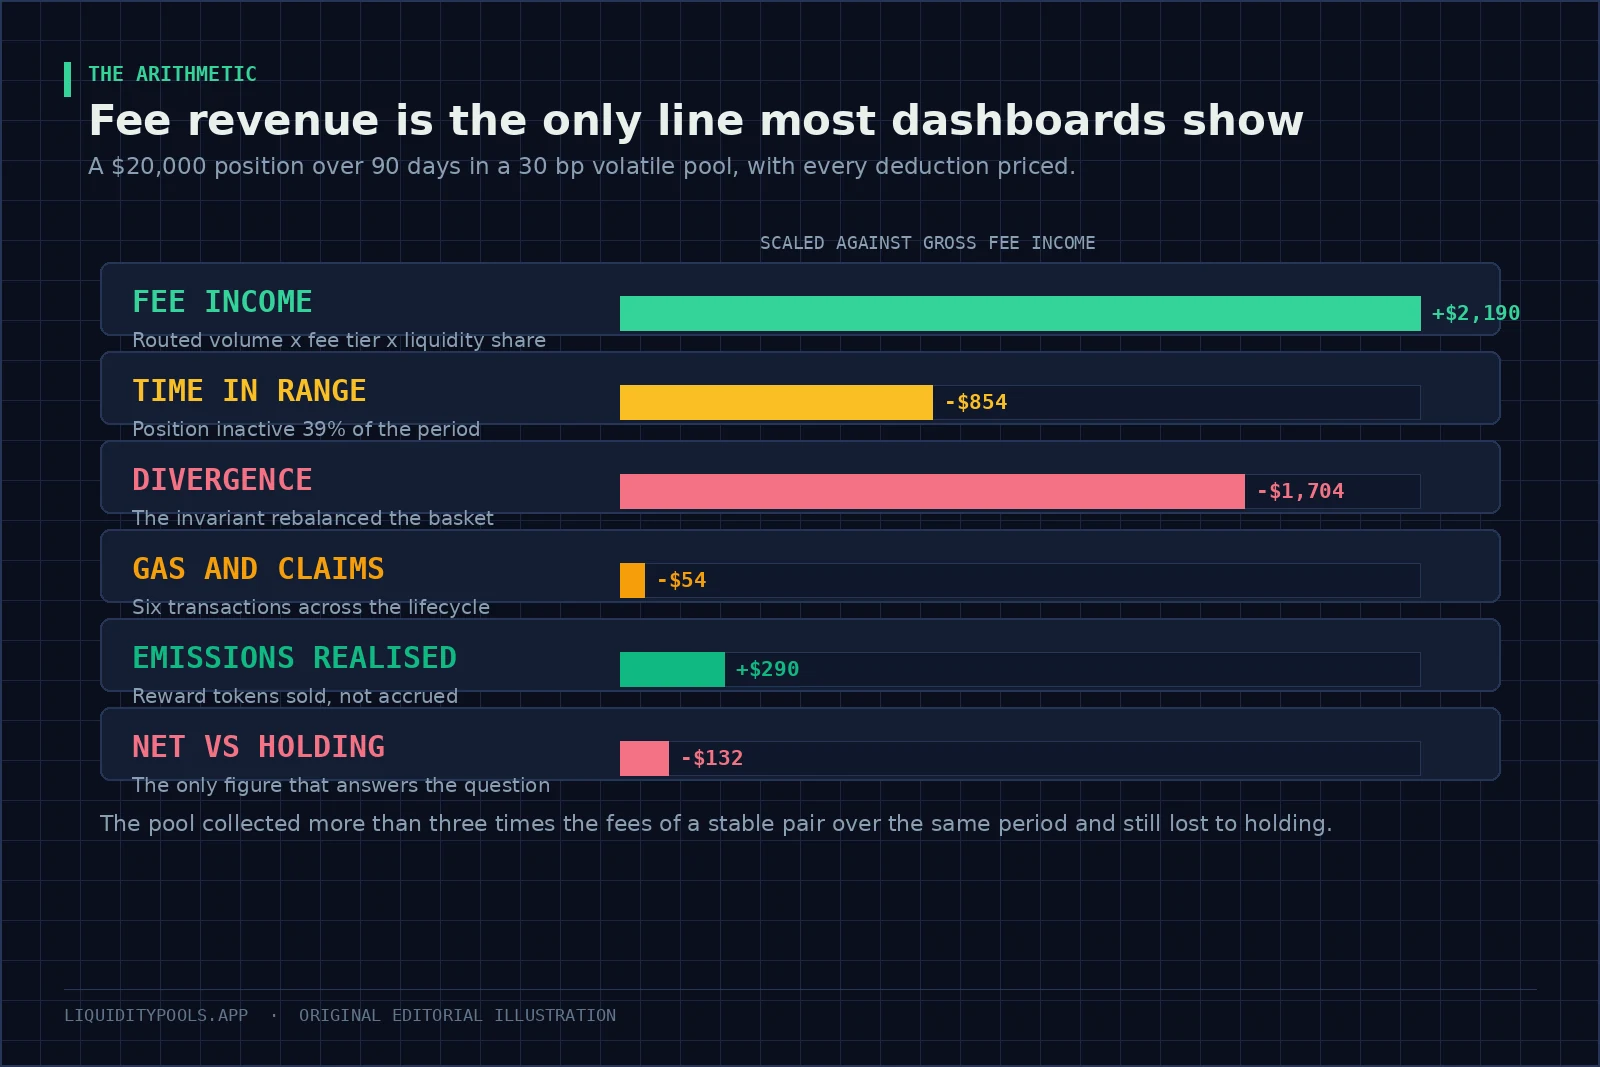
$20,000 each, both in a band. The stable pair sits at the 0.01% tier in a band from $0.995 to $1.005, and its price drifts to $1.003. The volatile major sits at the 0.30% tier in a band from $1,600 to $2,400, opened with the token at $2,000, and the token ends the period at $2,600, above the band. Fees while live, time in range and reward value are assumed; the divergence is computed from those prices.
| Stable pair, 0.01% | Volatile major, 0.30% | |
|---|---|---|
| Fees earned while live, assumed | $412 | $2,190 |
| Time in range, assumed | 99% | 61% |
| Fees after time in range | $408 | $1,336 |
| Divergence against holding | -$9 | -$1,850 |
| Gas, six transactions at $9 | -$54 | -$54 |
| Reward tokens, after selling | $0 | $290 |
| Net against holding | +$345 | -$278 |
| Annualised | 7.0% | -5.6% |
The volatile pool collected more than three times the fees and still lost to holding.
That is the characteristic shape of this problem. The fee line is on every dashboard. The lines that reversed the result are not. Rebuild the volatile column in the impermanent loss calculator’s range mode, entering fees and sold rewards together and subtracting the gas yourself, before depositing rather than after.
What the winners have in common
- High turnover against the liquidity competing for it. The input that matters most, because it drives the only revenue that persists without a budget.
- Tokens that move together. Divergence depends on relative movement, so pairs that track each other barely pay it. That is why stablecoin and staked-ETH pairs stay viable at rates that look trivial. See Stablecoin Liquidity Pools for the exception that ends this abruptly.
- A range you will actually maintain, or none at all. A full-range position with modest fees often beats a narrow one that sat idle half the time and was re-centred at a loss twice.
- Enough size that gas is noise.
- Economics that work with rewards at zero. If it does not, you are trading an incentive schedule, and should size it as one.
Research points the same way. A study of Uniswap v3 providers found simple, profitable strategies in pools with negligible volatility, but only modest returns; higher returns came with more risk and active management[1]. A BIS review of DeFi notes that trading fees may not be high enough to offset the loss from divergence at all[3]. Advertised rates tend to run the other way, highest in the volatile pools where the cost of providing is also highest.
Seven numbers to write down first
- Thirty-day routed volume for that specific pool, from chain data rather than a marketing page.
- Money working near the current price, not the pool’s total.
- Your resulting share, and the fee income it implies at that volume.
- How much the pair has actually moved, and the divergence that implies.
- For a range, what fraction of the time you expect to be in it.
- Gas for your whole intended lifecycle, including how often you claim.
- The same calculation with rewards set to zero.
If number seven is negative, you are buying an incentive schedule. That can be a reasonable trade, but it is a different trade, and it needs an exit tied to the emission calendar rather than to the pair.
Where to go next
Run the pool through the liquidity pool fee and APR calculator and the impermanent loss calculator, then apply the structured version in How to Evaluate a Liquidity Pool. For the loss side in full, see Can You Lose Money in a Liquidity Pool?.
References
- Risks and Returns of Uniswap V3 Liquidity Providers (Heimbach et al., 2022)
- Automated Market Making and Loss-Versus-Rebalancing (Milionis et al., 2022)
- DeFi risks and the decentralisation illusion (Aramonte, Huang & Schrimpf, BIS Quarterly Review, December 2021)
- Impermanent Loss in Uniswap v3 (Loesch et al., 2021)
- Uniswap v3 Core Whitepaper (Adams et al., 2021)
- What are the risks when providing liquidity? (Uniswap Labs)
- Fees (Uniswap Developer Documentation)
Frequently asked questions
Is providing liquidity profitable?
Sometimes, and the answer is pool-specific rather than general. Profitability requires fee income to exceed divergence loss plus gas plus the opportunity cost of the same exposure held unpooled. Pools with high routed volume relative to the liquidity competing for it clear that bar; pools paying a headline rate funded by token issuance usually do not once the reward token is valued at its realisable price.
How do liquidity providers make money?
From a share of the swap fee charged on every trade routed through the pool, proportional to how much of the liquidity active at the traded price is theirs. Some pools add token incentives on top. Fees are revenue from traders; incentives are dilution of token holders, and only the first persists without a budget.
Are liquidity pools worth it for small amounts?
Frequently not on high-fee chains. Entry, exit and each claim cost gas regardless of position size, so a $500 position that pays three transactions at $12 each (approve, deposit, withdraw) has spent about 7% of capital before earning anything. The same position on a low-fee chain can be viable.
How much do liquidity providers earn on average?
There is no reliable average because the distribution is wide and venue-specific. A study of 17 large Uniswap v3 pools in 2021 found impermanent loss exceeded fee income in aggregate, and about half of providers had negative returns. Treat any single quoted average as a marketing figure until you can reproduce it from pool data.
What makes a liquidity position unprofitable?
Four things, usually in this order: a pair that trended hard in one direction, a range the price left, gas and claim costs on a position too small to absorb them, and reward tokens that lost most of their value between accrual and sale.
Continue in this track
This is guide 8 of 16 in Risk & Research.
Next: Gas Costs for Liquidity Providers: The Minimum Viable Position →
Previous: ← LP Fees vs Impermanent Loss: Finding the Break-Even
See the full track sequence, or browse all 59 guides.